
Bitcoin attempted to start a recovery last week but that met with strong resistance from the bears near $22,500. The price has again dipped back to the psychologically crucial level of $20,000 where the bulls and the bears may witness a tough battle for supremacy.
The near-term picture remains clouded with uncertainty as all eyes will be focused on the United States inflation report due on July 13. Economists surveyed by Bloomberg expect consumer prices to surge to a new 40-year high of 8.8% in June.
Expectations of an aggressive monetary tightening by the United States have sent the US dollar index (DXY) soaring to a 20-year high above 108. Arthur Hayes, former CEO of derivatives trading platform BitMEX, tweeted on July 11 that the parity between the US dollar and the euro could force the central banks to resort to yield curve control. That could lead to the disintegration of the currency and trigger a massive rally in Bitcoin. Hayes asked his followers to “be patient” as this could take time.
Several analysts believe that Bitcoin will turn around after the Federal Reserve reverses its monetary tightening. And for that to happen, inflation needs to come down. There is a silver lining for the long-term investors as the inflation expectation for the three-year ahead period fell to 3.6% in June from 3.9% a month earlier, according to the New York Fed’s June Survey of Consumer Expectations published on July 11.
Although it is difficult to call a bottom, Jurrien Timmer, director of global macro at asset manager Fidelity Investments, said that Bitcoin was cheap at $20,000. Using the “price per millions of non-zero addresses as an estimate for Bitcoin’s valuation,” Timmer said that Bitcoin’s valuation was back to 2013 levels while the price had only dropped down to 2020 levels.
Is Bitcoin showing signs of a bottom formation? Is the current fall in Bitcoin price and major altcoins a buying opportunity? Has Bitcoin started a bottom formation? Read our analysis of the major cryptocurrencies to find out.
BTC/USD Market Analysis
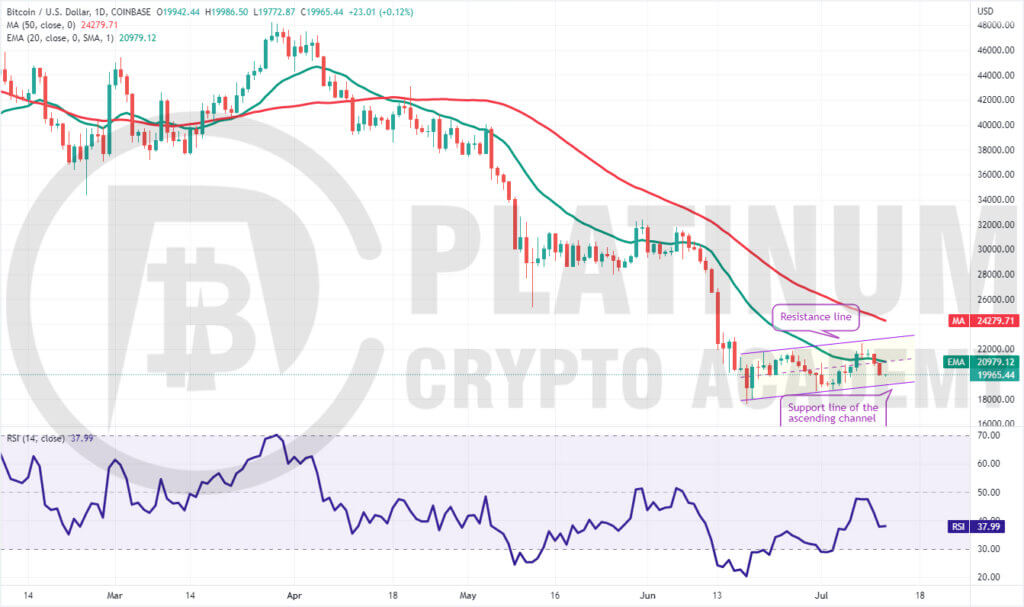
Bitcoin rallied above the 20-day exponential moving average on July 7 but the bulls could not build upon this advantage. The bears sold near $22,500 on July 8 and pulled the price back below the 20-day EMA on July 10.
The BTC/USD pair is trading inside an ascending channel pattern. The bears will now attempt to pull the price to the support line, which is likely to attract buyers.
If the price rebounds off the support line, the pair could rise to the 20-day EMA and then to the resistance line of the channel. The 20-day EMA is flat but the relative strength index (RSI) in the negative territory indicates a minor advantage to sellers.
If the price breaks below the channel, the bears will try to pull the pair to the strong support zone of $18,603 to $17,567.45. This remains an important zone to keep an eye on because if it cracks, the selling could intensify. The pair could then plummet to $16,000 and later to $14,000.
The bulls will have to push and sustain the price above the 50-day simple moving average (SMA) to indicate a potential trend change.
ETH/USD Market Analysis
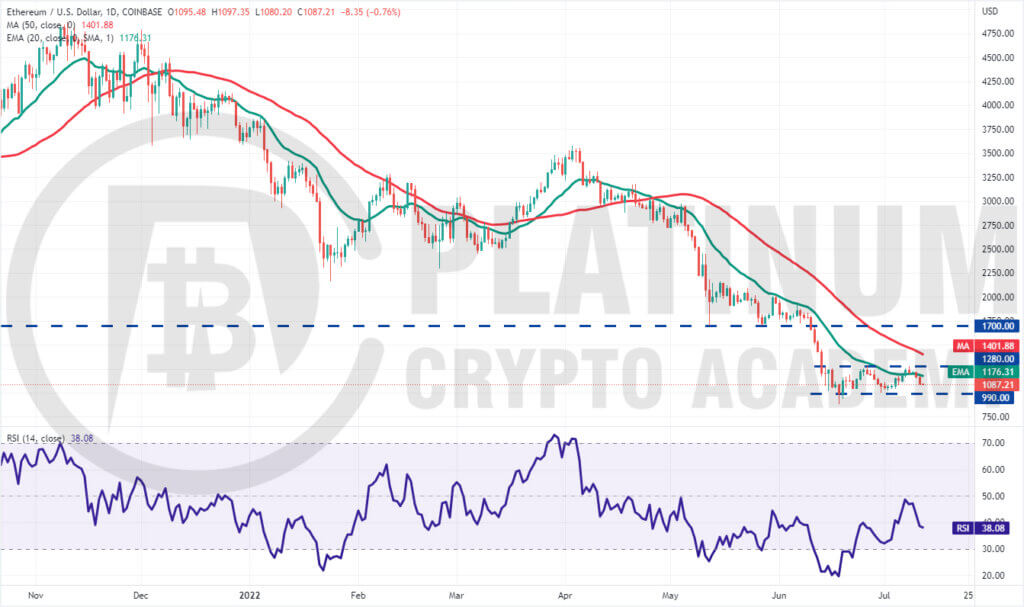
Ether rose above the 20-day EMA on July 7 but the bulls could not clear the overhead resistance at $1,280. This indicates that the bears are defending this level with vigour.
The ETH/USD pair slipped below the 20-day EMA on July 10 and could drop to the strong support at $990. A strong rebound off this level could keep the pair stuck between $990 and $1,280 for a few days.
The 20-day EMA is flattish but the RSI has dropped below 39, suggesting that bears have a slight edge.
If the price breaks below $990, the pair could retest the June 18 intraday low of $879.80. A break and close below this support could signal the start of the next leg of the downtrend. The pair could then drop to $828 and later to $700.
The buyers will have to push and sustain the price above the overhead resistance at $1,280 to indicate that the trend could be changing. The pair could then rise to the 50-day SMA and later to the breakdown level of $1,700.
BNB/USD Market Analysis
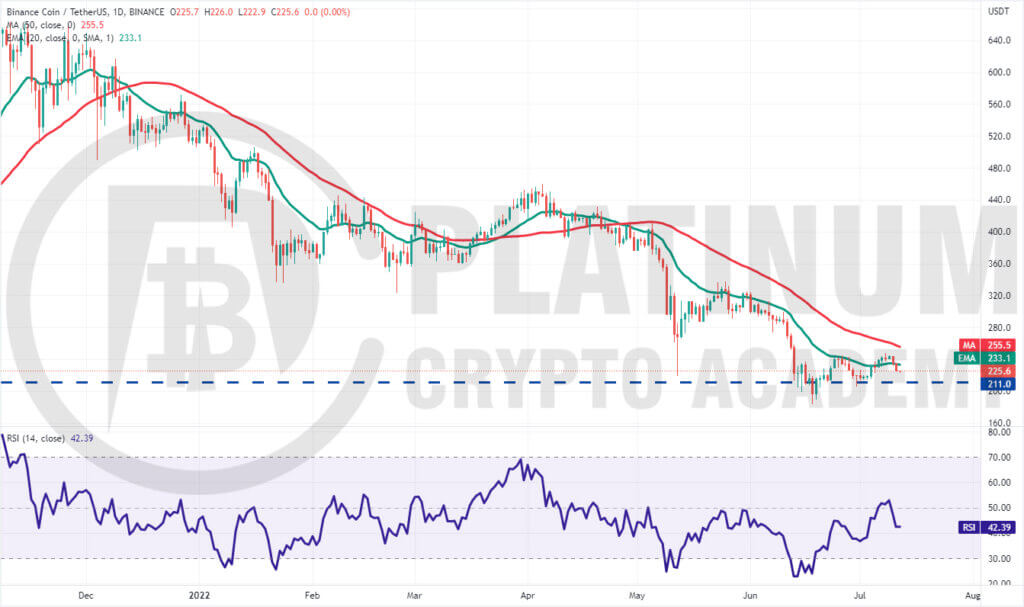
Binance Coin rose above the 20-day EMA on July 6 but the bulls could not push the price to the 50-day SMA. This suggests that demand dries up at higher levels. The bears pulled the price back below the 20-day EMA on July 11. The BNB/USD pair could now decline to the crucial support at $211.
This is an important level to keep an eye on because a strong rebound off it will suggest that bulls are attempting to form a floor at $211. The pair could then again attempt a rally to the 50-day SMA.
If the price turns down from this level, the pair may spend some time between $211 and $250. But if the buyers push the price above the 50-day SMA, the bullish momentum could pick up and the pair could rally to $300.
On the contrary, if the price breaks below $211, the bears will fancy their chances and attempt to sink the pair below $183.40. If that happens, the decline could extend to $150.
XRP/USD Market Analysis
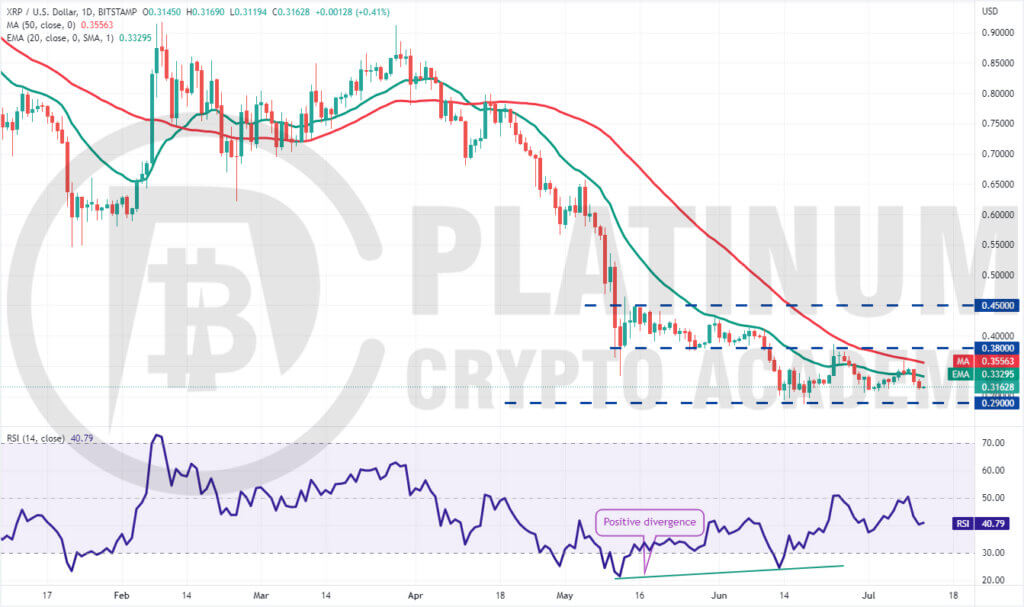
XRP is consolidating in a downtrend. The price turned down from the 50-day SMA on July 8 and the bears pulled the price below the 20-day EMA on July 10. The XRP/USD pair could now drop to the strong support at $0.29.
If the price rebounds off this level with strength, it will suggest that the pair may spend some more time inside the range between $0.29 and $0.38. The gradually downsloping moving averages and the RSI in the negative territory suggest that bears have the upper hand.
The next trending move could begin on a break above $0.38 or on a drop below $0.29. If the price breaks below $0.29, it will suggest the resumption of the downtrend. The pair could then drop to the next support at $0.24.
On the other hand, if bulls push the price above $0.38, the pair could rise to $0.50 where the bears may again mount a strong defence. A break and close above this level could indicate the start of a new uptrend.
ADA/USD Market Analysis
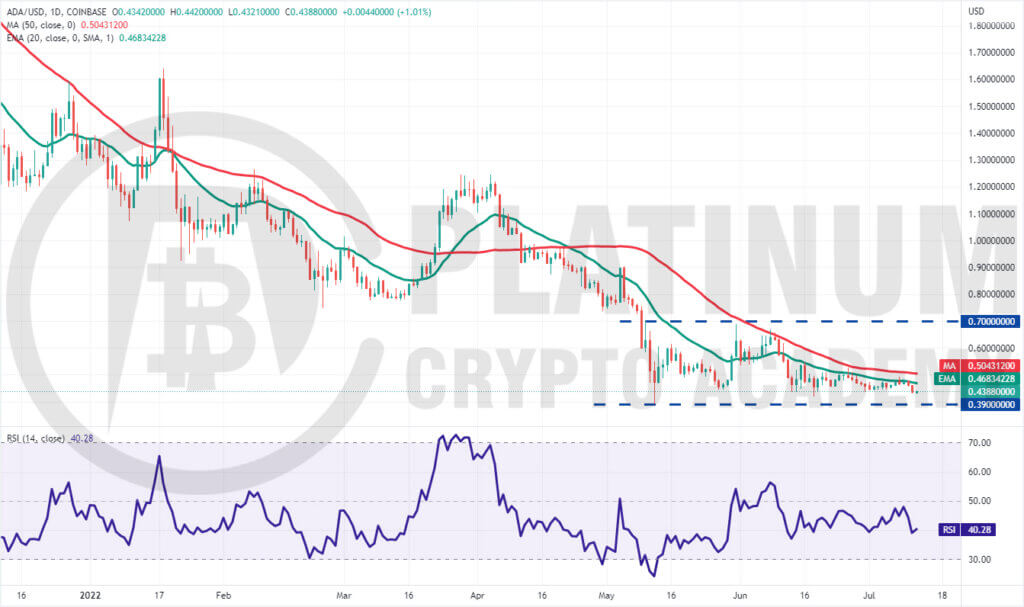
The bulls repeatedly failed to push and sustain Cardano above the 20-day EMA between July 7 to July 10. This indicates that bears are defending the zone between the 20-day EMA and the 50-day SMA with all their might.
The ADA/USD pair turned down from the 20-day EMA on July 10 and plunged to the strong support at $0.43. If this level cracks, the bears could challenge the critical support at $0.39.
If the price rebounds off this level, the buyers will make one more attempt to clear the overhead hurdle at the moving averages. A break and close above the 50-day SMA could suggest that the bears may be losing their grip.
On the contrary, if the price breaks below $0.39, the pair could start the next leg of the downtrend. The pair could then decline to $0.35 and later to $0.30.
Hopefully, you have enjoyed today’s article for further coverage please check out our crypto Blog Page. Thanks for reading! Have a fantastic day! Live from the Platinum Crypto Trading Floor.
Earnings Disclaimer: The information you’ll find in this article is for educational purpose only. We make no promise or guarantee of income or earnings. You have to do some work, use your best judgement and perform due diligence before using the information in this article. Your success is still up to you. Nothing in this article is intended to be professional, legal, financial and/or accounting advice. Always seek competent advice from professionals in these matters. If you break the city or other local laws, we will not be held liable for any damages you incur.
