
Hi Crypto Network,
For the past few weeks, crypto traders have been fixated on the $10,000-$10,500 zone for Bitcoin. Repeated attempts to scale this zone have failed. While this is an important event for short-term traders, long-term investors should not be worried.
The current economic situation, with all the monetary easing and stimulus measures, is bullish for Bitcoin.
Bloomberg’s report forecasts that Bitcoin will not only make a new all-time high at $20,000, it can even reach $28,000. The report suggests that Bitcoin’s performance during the current crisis is a huge positive. This has attracted institutional players as seen from the huge inflows into Grayscale.
While Bitcoin purchases by Grayscale have been in the focus for the past few days, Grayscale’s director of investor relations, Ray Sharif-Askary, recently said that the institutions are also buying Ether. In 2020, the fund has purchased $110 million worth of ETH. This shows that institutional investors are using both Bitcoin and Ether to hedge their portfolios.
After the initial euphoria of buying stocks, traders will realise that an economic recovery to pre-pandemic levels will take time. Also, central banks will struggle to remove all the additional stimulus that has been pumped into the system. Then, investors are likely to flock to safe havens like gold and Bitcoin. However, that might not happen overnight. Hence, investors should be patient and hold their positions without getting perturbed by the daily swings.
BTC/USD
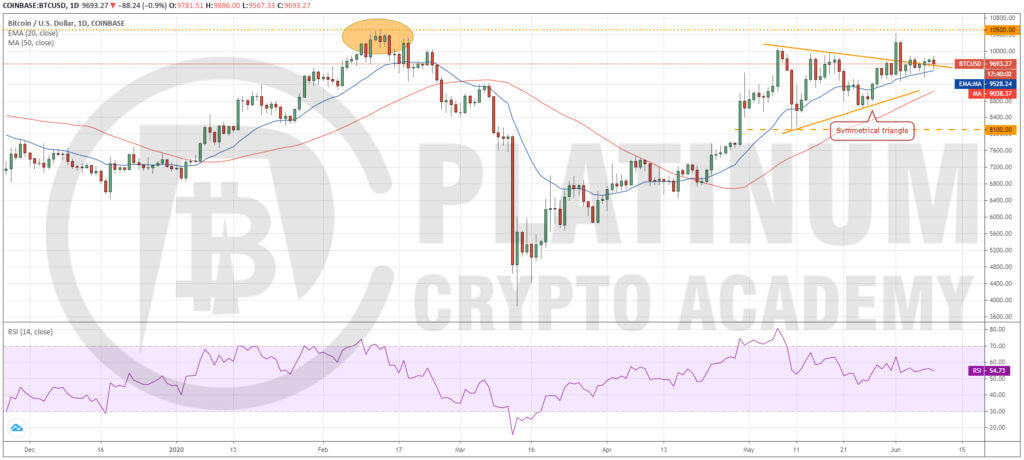
We had cautioned traders in our previous analysis that $10,500 is a stiff hurdle to cross and a pullback was likely. And that is what happened. On June 2, Bitcoin slumped back into the triangle. This suggests that the bears are aggressively defending the $10,500 levels.
The only positive is that the bulls have not allowed the price to dip below the 20-day EMA. This indicates that the bulls are accumulating on dips. If the BTC to USD pair rebounds off the 20-day EMA, the bulls will make one more attempt to scale above $10,500.
If successful, a sustained uptrend is likely to begin that can carry BTC towards lifetime highs. However, it will not be a straight move up because the rally will have to clear several resistances in between. The first stop is likely to be $12,000.
Conversely, if the pair turns down from $10,500 levels once again and slips below the 20-day EMA, it could result in the liquidation of several long positions. The selling is likely to exacerbate on a break below the 50-day SMA and the trend will turn in favour of the bears on a break below the critical support of $8,100.
The traders can buy if the pair sustains above $9,900 for a few hours. The stop-loss for the trade can be kept at $9,300 initially and can be raised to breakeven if the bulls struggle to scale the $10,500 resistance.
ETH/USD
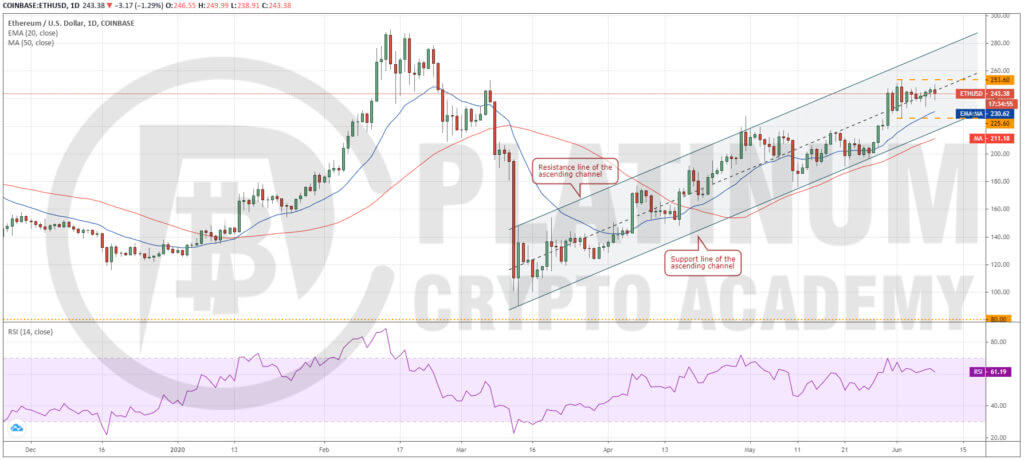
Ether has been trading between $253.60 and $225.60, which is the high and low of the intraday range on June 2. This suggests that both the bulls and the bears are not sure whether the biggest altcoin will move up or down.
If the price rises above $253.60, it will indicate that the bulls have overpowered the bears and a rally to the resistance line of the ascending channel is likely. The upsloping moving averages and the RSI in the positive territory indicate that bulls are in command.
However, if the ETH to USD pair turns down from the current levels and breaks below $225.60, it will signal that bears have absorbed all the buying. The support line of the ascending channel might offer support but if the bears sink the price below the channel, a deeper correction is likely.
Conversely, if the bulls defend the support line of the channel, another attempt to carry the price above $253.60 is possible.
Aggressive traders can buy on a breakout and close (UTC time) above $253.60 with a close stop-loss. The stops can be trailed higher as the price moves northwards. Another buying opportunity can crop up if the pair rebounds off the support line of the channel. The stop for this trade can be kept just below the channel.
XRP/USD
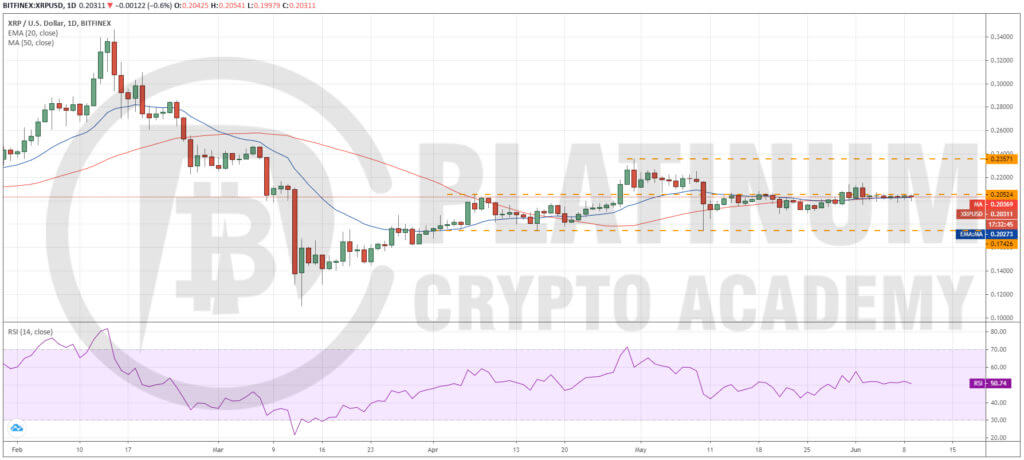
XRP has been a huge underperformer for the past few months. This suggests that buying interest dries up at higher levels. On June 2, the volatility would have triggered both our buy and the stop-loss in a single four-hour window.
Since then, the price has remained close to $0.20524 without much activity. Although the bears attempted to drag the price to the bottom of the large $0.17426-$0.23571 range, they have not been able to sustain the selling pressure at lower levels.
After the current phase of consolidation, the XRP to USD pair is likely to reach the boundaries of the range. However, it is difficult to predict whether the price will move up or down because the price pattern or the indicators are not giving any clear clue.
During such times, it is best that traders sit on the sidelines and wait for a trending move to start. A breakout of $0.23571 can be a major event that can result in a new uptrend.
Hence, a breakout and close (UTC time) above $0.23571 should be purchased. The first target objective is $0.285 and then $0.30.
BCH/USD
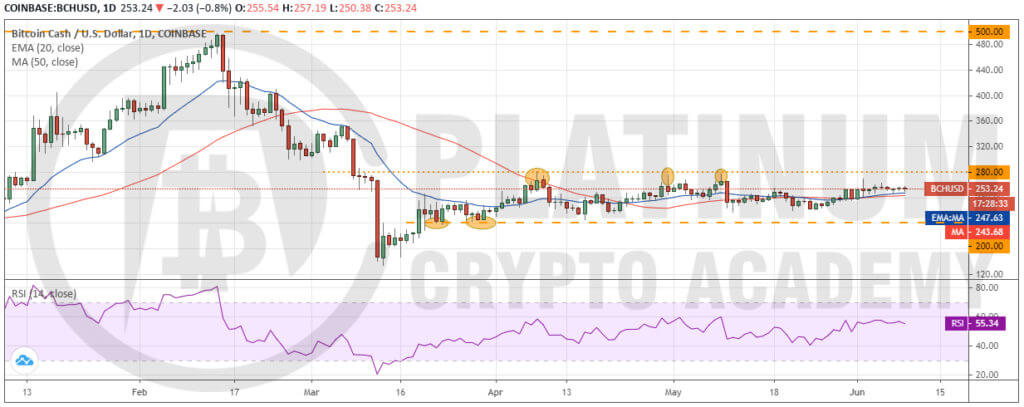
Bitcoin Cash scaled above the moving averages on May 30 but has not been able to reach the resistance of the range at $280. This suggests a lack of buyers at higher levels.
As the price did not move up, aggressive traders are likely to have closed their positions. This has resulted in a pullback to the moving averages once again.
If the bears sink the price below the moving averages, a drop to $217.83 and then to $200 is possible. A break below this support will start a new downtrend.
Conversely, if the BCH to USD pair bounces off the moving averages, the bulls will try to push the price to $280. This is the critical resistance to watch out for because if this level is crossed, a new uptrend is likely.
The traders can buy on a close (UTC time) above $280 with a stop-loss of $235 and a target objective of $350.
BSV/USD
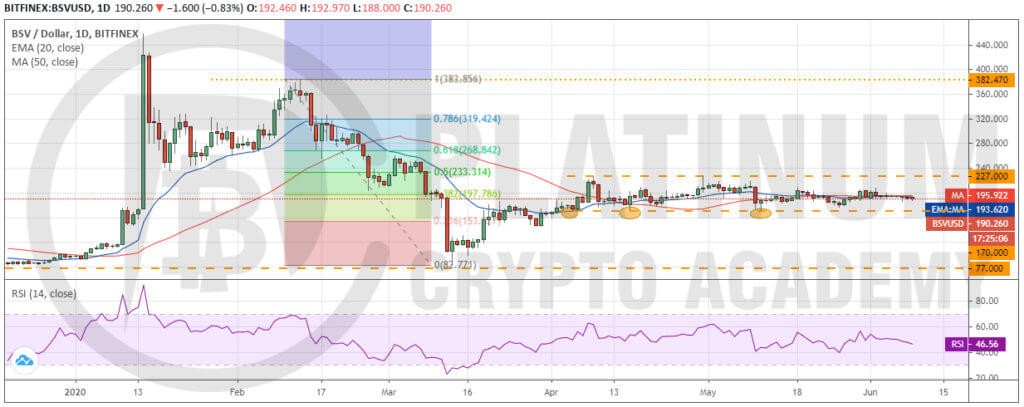
The traders seem to have abandoned Bitcoin SV as it is not giving any opportunities either to go long or short. It is stuck in a $170-$227 range but since May 11, it has not touched either boundary of the range.
Currently, the BSV to USD pair has dipped below the moving averages. The bears might try to sink the price to the support at $170. If this support cracks, a new downtrend is likely. However, if the pair rebounds off $170, it can offer a buying opportunity with the stop placed below $170.
The pair will indicate strength if the price scales above $210 but a new uptrend will be signalled if the bulls can push the price above $227. This can also offer a buying opportunity to the traders with a close stop-loss. Above $227, a rally to $260 and then to $300 is possible.
Hopefully, you have enjoyed today’s article. Thanks for reading!
Have a fantastic day!
Live from the Platinum Crypto Trading Floor.
Earnings Disclaimer: The information you’ll find in this article is for educational purpose only. We make no promise or guarantee of income or earnings. You have to do some work, use your best judgement and perform due diligence before using the information in this article. Your success is still up to you. Nothing in this article is intended to be professional, legal, financial and/or accounting advice. Always seek competent advice from professionals in these matters. If you break the city or other local laws, we will not be held liable for any damages you incur.
