
Bitcoin and the crypto sector received a boost after the United States Federal Reserve hiked rates by 75 basis points on July 27 but Chairman Jerome Powell said that future rate hikes will be decided based on the economic data points and the outlook for the economy. With the next Fed meeting only in September, traders will focus on various economic data that will be released in August. Traders expect that softening data may slow down the pace of rate hikes in the future.
After three consecutive negative monthly closes, Bitcoin made a comeback in July with a 16.8% gain, according to Coinglass data. In comparison, Ether had much better performance as it rallied more than 56% during the same period. This indicated that investors may have started accumulating at lower levels, anticipating that a bottom may be in place.
Mike McGlone, senior commodity strategist at Bloomberg Intelligence, said in a tweet on July 29 that “Fed Chairman Jerome Powell’s “meeting by meeting” comment may mark the pivot for Bitcoin” to outperform most assets. In another tweet on July 31, McGlone said that Bitcoin may be on track to recover from the “steepest discount” to the 100- and 200-week moving averages. He added that the risk-to-reward ratio may be “tilted favourably for one of the greatest bull markets in history.”
However, not everyone is convinced that a bottom has been made. Glassnode cited several on-chain metrics and said in the weekly on-chain newsletter titled “Beginnings of a Bear Market Rally” that the rise in Bitcoin and Ethereum is not supported by strong transactional demand and “this rally has not yet seen a convincing follow through in observable demand activity.”
Bitcoin and major altcoins have started August on a cautious note. Could lower levels attract buyers and resume the recovery in the next few days? Read our analysis of the major cryptocurrencies to find out.
BTC/USD Market Analysis
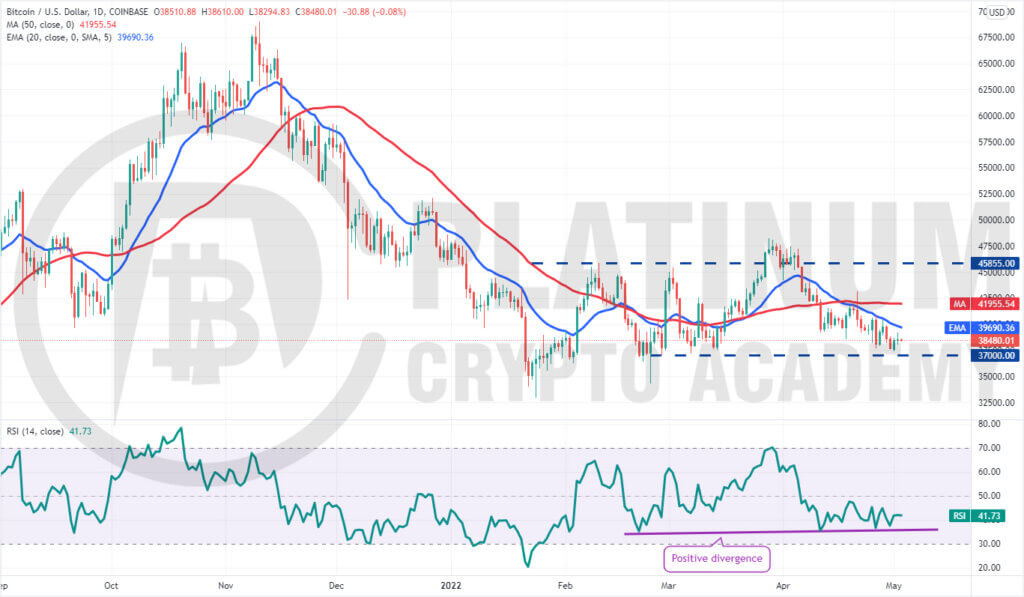
Bitcoin reversed direction from $20,715 on July 26 and rose above the ascending channel on July 28. However, the bulls could not build upon this advantage and sustain the higher levels. This indicates that bears continue to sell on rallies.
The failure to sustain the price above the channel may have attracted profit-booking from short-term bulls and shorting from aggressive bears. That has pulled the price to the 20-day exponential moving average (EMA).
This is an important level to keep an eye on. If the price rebounds off the 20-day EMA, the bulls will again try to push the price above the overhead resistance at $24,666. If they succeed, the BTC/USD pair could start an up-move toward $30,000.
Alternatively, if the price slips below the 20-day EMA, it will suggest that the bullish momentum may be weakening. The pair could then decline to the 50-day simple moving average (SMA).
The flattening 20-day EMA and the relative strength index (RSI) near the midpoint suggest a range-bound action in the near term. The pair may remain stuck between $20,715 and $24,666 for a few days.
ETH/USD Market Analysis
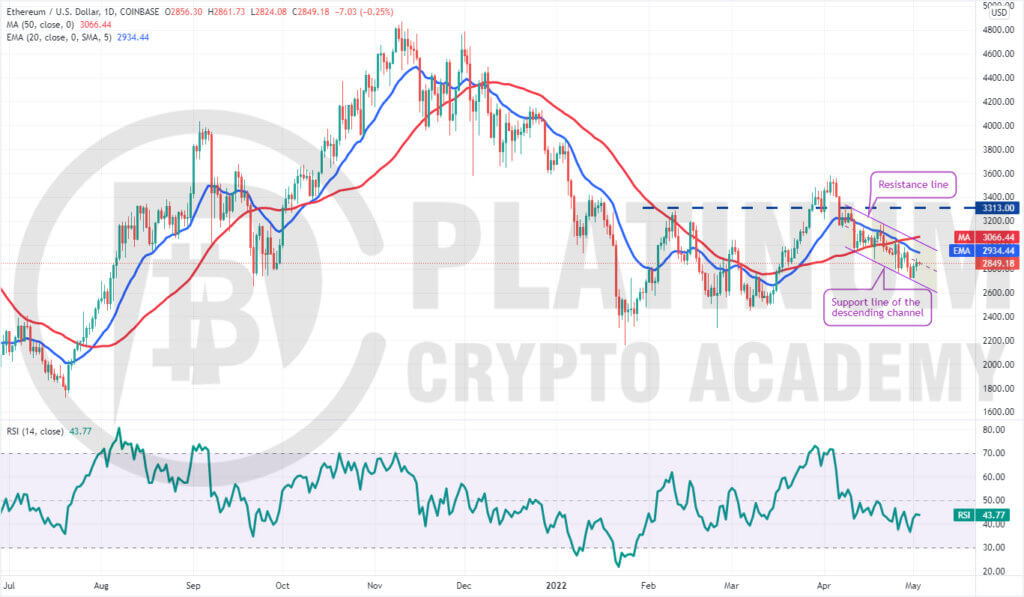
Ether rebounded off the 20-day EMA on July 26 and rose above the $1,700 resistance on July 28. However, the buyers could not sustain the higher levels, indicating aggressive selling by the bears.
That may have attracted profit-booking from short-term traders and the price dipped back below $1,700 on July 30. The bears have kept up the pressure and the ETH/USD pair has reached the 20-day EMA.
This is an important level to watch out for because a strong bounce off it will suggest that traders are buying on dips. This indicates that the sentiment has turned positive.
The bulls will then attempt to clear the overhead resistance zone between $1,700 and $1,800. If they manage to do that, the pair could rally to $2,000 and then to $2,164.
Conversely, a break below the 20-day EMA will suggest that the pair may drop to the strong support at $1,280. A rebound off this level may keep the pair stuck between $1,280 and $1,700 for a few days.
BNB/USD Market Analysis
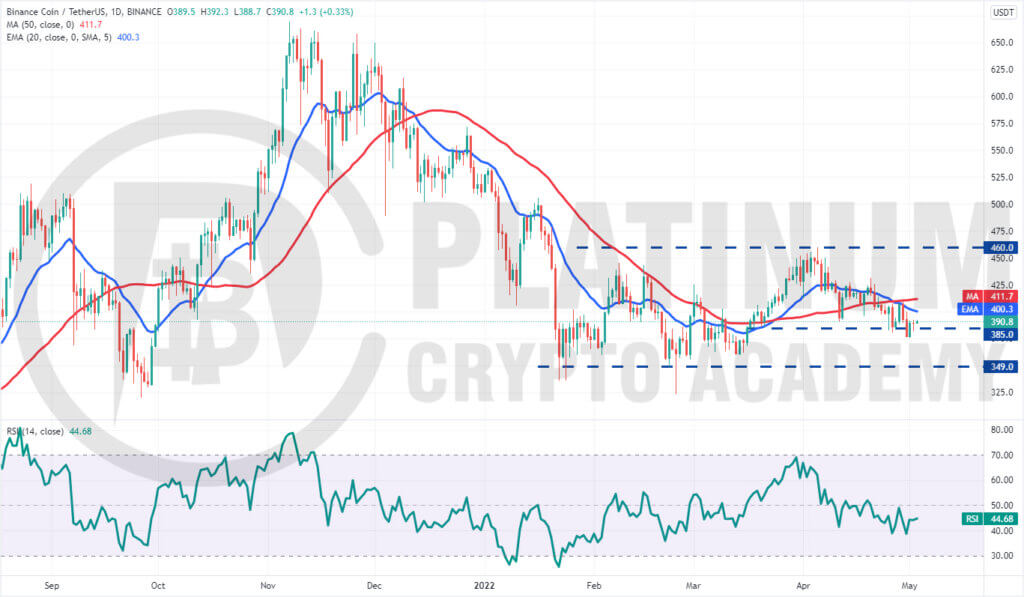
Binance Coin turned up from the 50-day SMA on July 26 and rose above the resistance line of the ascending channel on July 29. However, the bears did not allow the rally to sustain above the psychological barrier of $300.
The price turned down and slipped back into the channel on July 30. The bulls again tried to push the price above the channel on July 31 but the bears did not relent. This attracted selling by traders and the BNB/USD pair could now drop to the 20-day EMA.
This is an important level for the bulls to defend. If the price rebounds off the 20-day EMA, it will suggest that the sentiment has turned positive and traders are buying on dips. The pair could again rise to $300 which remains an important hurdle to cross.
If bulls push and sustain the price above $300, the rally could pick up momentum and extend to $340.
On the contrary, if the price breaks below the 20-day EMA, the pair could slide toward the 50-day SMA. The bears will have to sink the price below this level to gain the upper hand.
XRP/USD Market Analysis
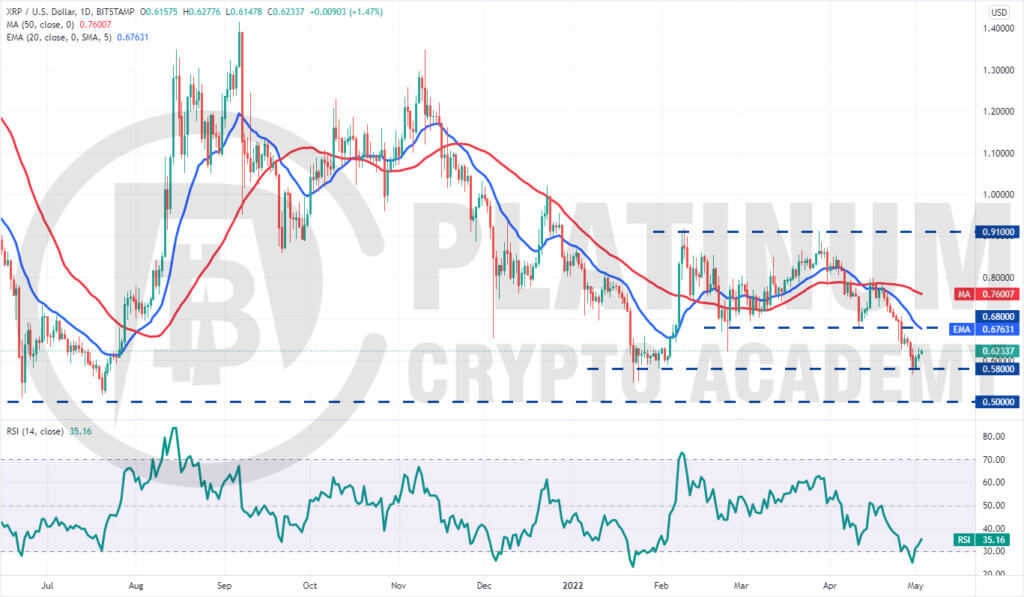
XRP turned up from $0.32 on July 26 and rallied above the overhead resistance of $0.38 on July 30. However, the long wick on the day’s candlestick shows that bears continue to sell aggressively at higher levels. That pulled the price back below $0.38 on July 31.
The bulls attempted to resume the recovery on August 1 and August 2 but the bears continued to sell on rallies. If bears sink the price below the 20-day EMA, the XRP/USD pair could drop to the 50-day SMA.
A break below this support will suggest that the pair may consolidate inside the $0.38 to $0.29 range for a few more days.
Conversely, if the price rebounds off the 20-day EMA, the buyers will again try to clear the overhead hurdle and push the pair to $0.45.
ADA/USD Market Analysis
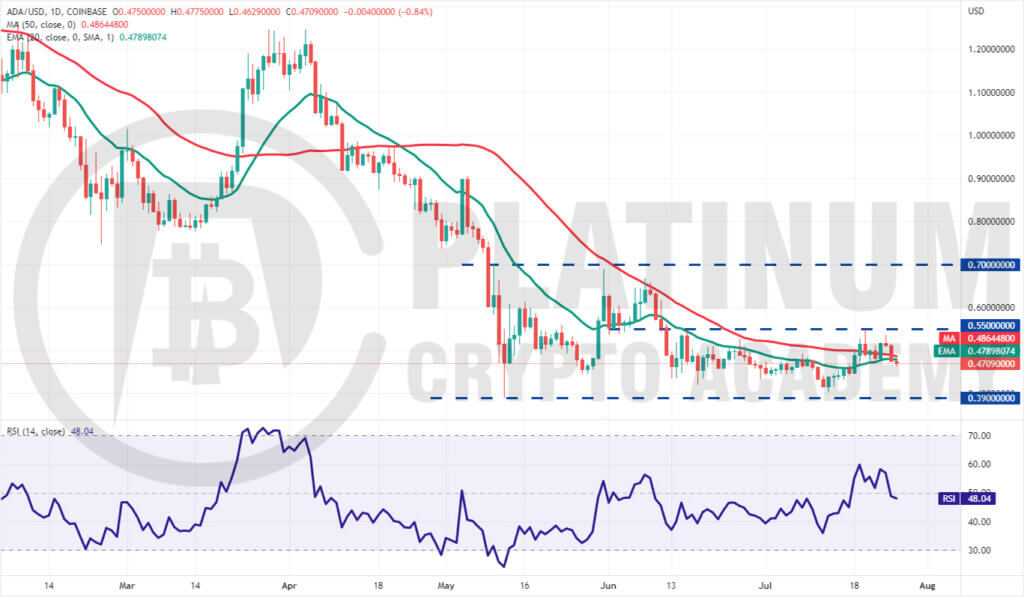
Cardano continues to trade inside a large range between $0.39 and $0.55. The bulls tried to push the price above the overhead resistance between July 29 and July 31 but the bears did not relent.
The price turned down and has broken below the 20-day EMA. This suggests that the pair may oscillate between $0.45 and $0.55 for some time. The flattening moving averages and the RSI near the midpoint also suggest a range-bound action in the near term.
If the price rebounds off the moving averages, the buyers will again try to clear the overhead resistance. If they succeed, the ADA/USD pair could rally to $0.70 where the bears may again pose a strong challenge.
On the other hand, a break below $0.45 could drag the pair down to the crucial support at $0.39.
Hopefully, you have enjoyed today’s article for further coverage please check out our crypto Blog Page. Thanks for reading! Have a fantastic day! Live from the Platinum Crypto Trading Floor.
Earnings Disclaimer: The information you’ll find in this article is for educational purpose only. We make no promise or guarantee of income or earnings. You have to do some work, use your best judgement and perform due diligence before using the information in this article. Your success is still up to you. Nothing in this article is intended to be professional, legal, financial and/or accounting advice. Always seek competent advice from professionals in these matters. If you break the city or other local laws, we will not be held liable for any damages you incur.
