Hi Crypto Network,
The speculators who had purchased Bitcoin expecting the halving to propel prices higher in the short-term could be liquidating their positions as the largest cryptocurrency has failed to sustain above $10,000. This could be one of the reasons for the fall in Bitcoin’s price in the past few days.
While the short-term sentiment has turned weak, the long-term picture looks strong. Crypto fund manager Grayscale Investments has said that average inflows in Q1 of this year has increased over 800% from Q1 2019. This is an encouraging sign because 90% of the investors in Grayscale are institutional players.
In the past three months, Grayscale has lapped up about 34% of the newly mined Bitcoin during that period. If the investment trend continues, expectations are that by March 21, the fund would have purchased about 3% of the total Bitcoin in circulation. This suggests that institutional investors are diversifying their portfolio by adding Bitcoins to it.
Another interesting event last week was that an early miner moved about 50 Bitcoins for the first time in over a decade. That gave rise to speculations on whether Satoshi Nakamoto was cashing his Bitcoins. However, several analysts were quick to dismiss this idea as they said that it was some other early miner but not Nakamoto.
BTC/USD
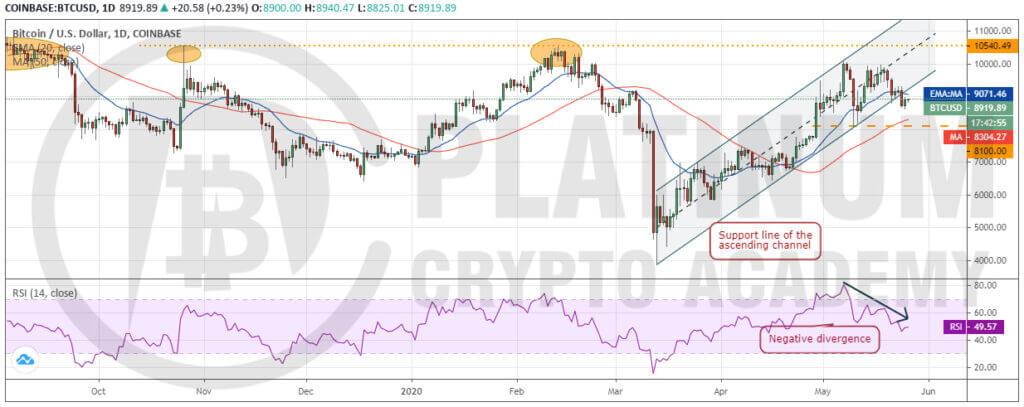
We had cautioned traders in our previous analysis that a pullback was possible and that is what happened. On May 20, Bitcoin once again turned down from the $10,000 overhead resistance and plunged below the 20-day EMA on May 21.
Although the bulls defended the support line of the ascending channel on May 21, the bounce lacked strength. This indicated that the bulls were not buying aggressively.
As a result, on May 24, the BTC to USD pair turned down and plunged below the channel. This break suggests that the uptrend might be over in the short-term. The pair is now likely to drop to the 50-day SMA and below it to the critical support at $8,100.
If the bulls buy the dip to the support at $8,100, the pair might remain range-bound between $8,100-$10,000 for a few days. Hence, a bounce off $8,100 can be purchased with a close stop placed just below the support.
The 20-day EMA has flattened out and the RSI is also close to the midpoint. This suggests that Bitcoin is likely to consolidate for a few days.
This view will be invalidated if the selling pressure sinks the pair below $8,100. In such a case, the trend will turn in favour of the bears.
ETH/USD
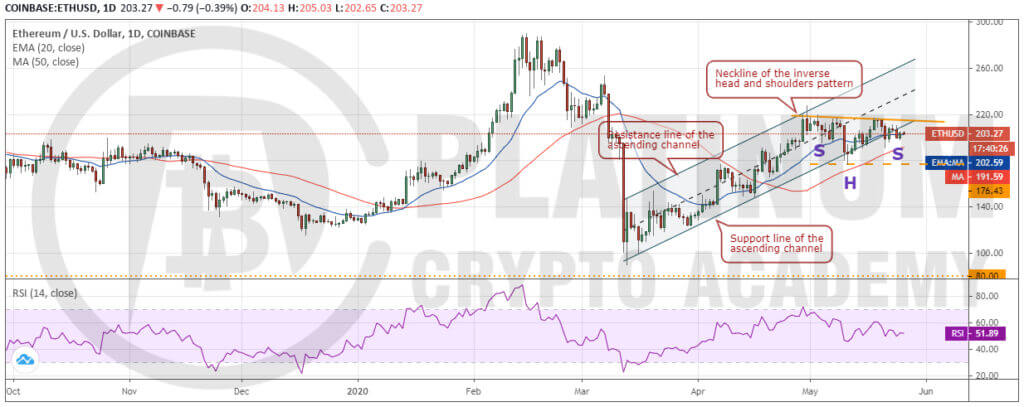
Ether failed to break out of the $220 resistance level for three days in a row between May 18-20. In trading, one must be ready for both eventualities. Hence, we had suggested traders’ book partial profits on positions if the bulls struggle to scale the price above $220 and keep the stops on the rest of the position at breakeven.
Traders who followed our previous recommendation would have booked partial profits and the rest of the positions would have closed at breakeven.
The ETH to USD pair plummeted on May 21 and broke below the ascending channel. This is a negative sign as it suggests a change in trend. However, the pair has not given up much ground after breaking below the channel, which indicates a lack of sellers at lower levels.
If the bulls can push the price back into the channel and scale the neckline of the inverse head and shoulders pattern, the uptrend will resume. The traders can buy on a close (UTC time) above the neckline with a target objective of $255. The stop-loss for this trade can be kept at $190. The stops can be trailed higher as the price moves northwards.
This bullish view will be invalidated if the pair turns down from the current levels and breaks below the 50-day SMA. Below this level a drop to $176.43 is likely.
XRP/USD
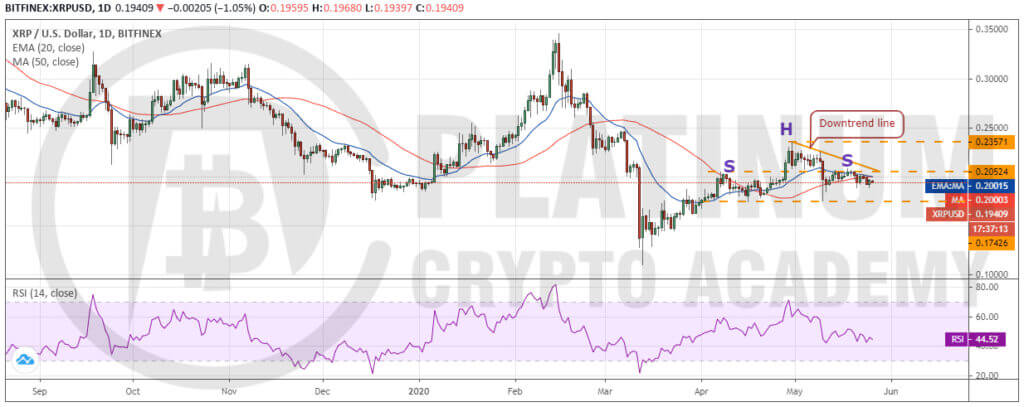
XRP has been an underperformer for the past many months. The bulls are struggling to propel the price above the 20-day EMA, which suggests a lack of demand at higher levels.
The 20-day EMA has started to slope down and the RSI has been trading between 40 and 50 levels for the past few days. This suggests that the bears have a slight edge.
If the bulls fail to push the price above the downtrend line within the next few days, a drop to $0.17426 is possible. A break and close (UTC time) below this support will complete a H&S pattern that has a target objective of $0.11281.
This bearish view will be invalidated if the bulls push the XRP to USD pair above the downtrend line. In such a case, a rally to $0.22506 and then to $0.23571 is possible.
BCH/USD
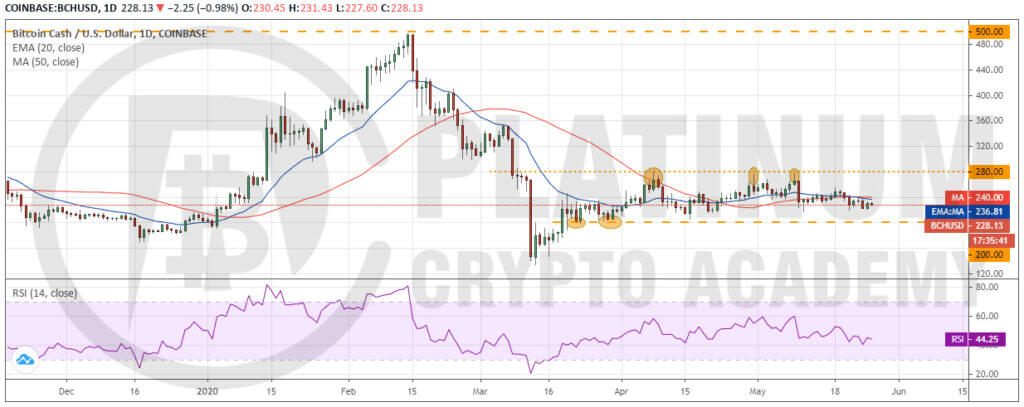
Bitcoin Cash continues its listless range-bound action between $200-$280. When trading in a range, the price action is usually volatile and is difficult to predict. Therefore, traders should avoid buying or selling when the price is close to the middle of the range.
The best time to buy would be to wait for the price to bounce off the support of the range as this gives a low-risk buying opportunity. Another possible trading opportunity can present itself after a breakout of the range. Until then, the traders can wait on the side-lines.
Currently, the BCH to USD pair is trading just below the moving averages. If the pair turns down from the moving averages once again, a drop to the support of the range at $200 is possible, which could offer a buying opportunity.
Conversely, if the bulls can propel the price above the moving averages, a move to $255 and then to $280 is likely.
BSV/USD
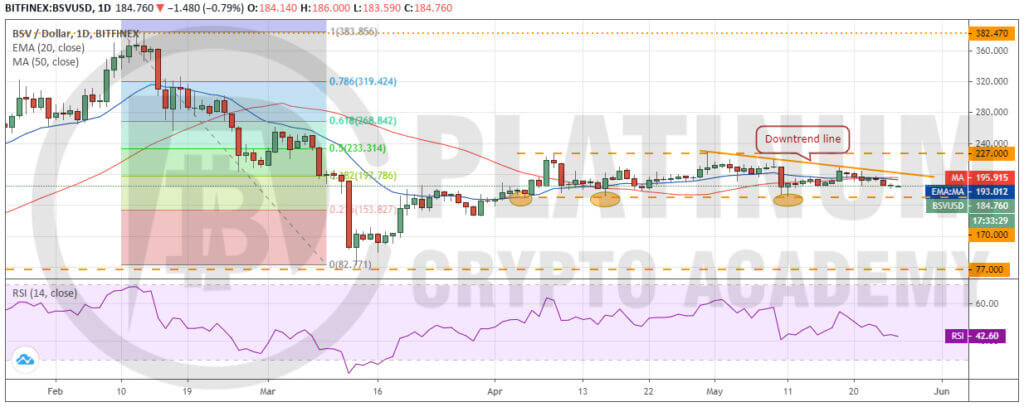
Bitcoin SV has been trading below the moving averages for the past few days, which is a negative sign. The bears will now try to drag the price to support of the range at $170. If the price bounces off this support, it can offer a buying opportunity.
However, as the BSV to USD pair has been an underperformer, the position size of the trade should be small. On the upside, a move to the downtrend line and above it to $227 is possible.
Conversely, if the bears sink the price below $170, the trend will turn in favour of the bears. The next support on the downside is $146 and if that also breaks, the decline can extend to $125.
Hopefully, you have enjoyed today’s article. Thanks for reading!
Have a fantastic day!
Live from the Platinum Crypto Trading Floor.
Earnings Disclaimer: The information you’ll find in this article is for educational purpose only. We make no promise or guarantee of income or earnings. You have to do some work, use your best judgement and perform due diligence before using the information in this article. Your success is still up to you. Nothing in this article is intended to be professional, legal, financial and/or accounting advice. Always seek competent advice from professionals in these matters. If you break the city or other local laws, we will not be held liable for any damages you incur.


