
Bitcoin made a strong comeback in October and rose about 28%, indicating that the bulls are back in the driver’s seat. In comparison, the S&P 500 Index is down about 3% during the same period. This shows that Bitcoin has decoupled from the S&P 500 Index in the short term.
One of the main reasons for the solid performance of Bitcoin is that market participants are increasingly hopeful that the United States Securities and Exchange Commission (SEC) will approve a spot Bitcoin exchange-traded fund (ETF) in the near future. This excitement increased after market observers noted that the iShares spot Bitcoin ETF proposed by investment firm BlackRock was listed on the Depository Trust & Clearing Corporation (DTCC).
Bloomberg ETF analyst Eric Balchunas said in a blog post on X (formerly Twitter) on October 24 that the listing on DTCC “was part of the process of bringing ETF to market.” However, a DTCC spokesperson later said that the listing of the iShares Bitcoin ETF has been there since August and it does not indicate any regulatory approval. However, this clarification did not dent the bullish sentiment in Bitcoin.
Asset management platform CoinShares said in a report on October 30 that digital asset investment products witnessed inflows of $326 million, with Bitcoin seeing 90% of the inflows at $296 million in the week ending October 27. This shows that institutional investors are positive about the crypto markets and expect the rally to continue further.
Analysts are positive about the markets as they expect Bitcoin’s price to soar after the approval for a spot Bitcoin ETF from the regulator. Galaxy Digital research associate Charles Yu said in an October 24 blog post that after Bitcoin ETFs are launched in the US, Bitcoin’s price may surge by 74.1% in the first year.
Could Bitcoin and select altcoins extend their up-move in the next few days? Will altcoins also follow Bitcoin higher? Let’s study the charts to find out.
BTC/USD Market Analysis
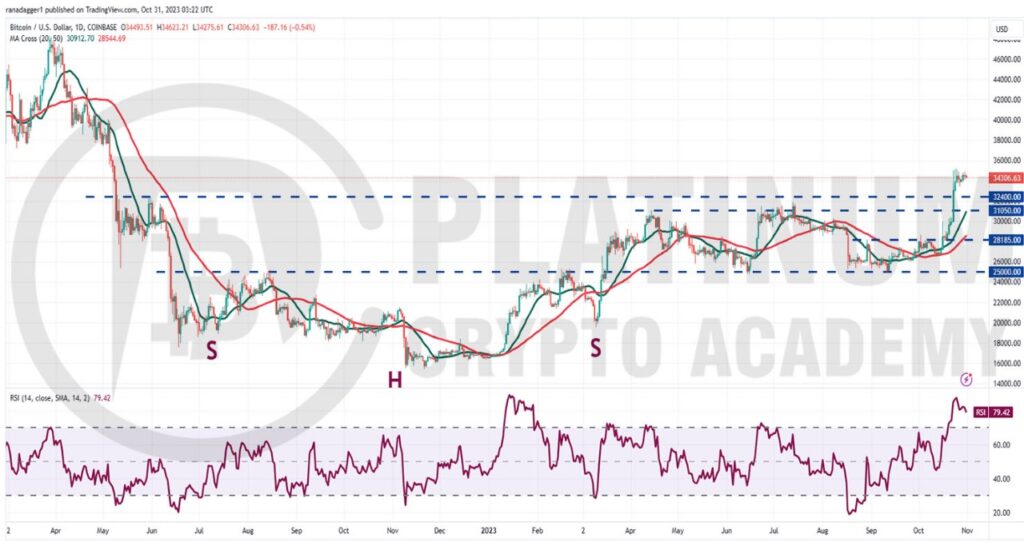
Bitcoin has been on a scintillating run for the past few days. The bulls pushed the price above the overhead resistance of $28,185 on October 16 and successfully held the retest of the breakout level on October 17-19.
That attracted aggressive buying by the bulls who propelled the BTC/USD pair above the overhead zone between $31,050 and $32,400.
The sharp rally extended to $35,157 on October 24 but that pushed the relative strength index (RSI) deep into the overbought territory. That started a consolidation with the price remaining between $35,157 and $33,400.
A consolidation after a strong rally is a positive sign as it shows that the bulls are not rushing to the exit. That increases the likelihood of the resumption of the uptrend. The pair may then surge to the next major resistance at $40,000. The bulls may find it difficult to overcome this barrier.
On the downside, $33,400 is the immediate support to watch out for. If this level gives way, the pair may slide to $32,400 and then to $31,050. This zone is likely to attract aggressive buying by the bulls.
The trend will turn negative if bears sink the price below the 20-day exponential moving average (EMA) but we give it a low probability of occurring.
ETH/USD Market Analysis
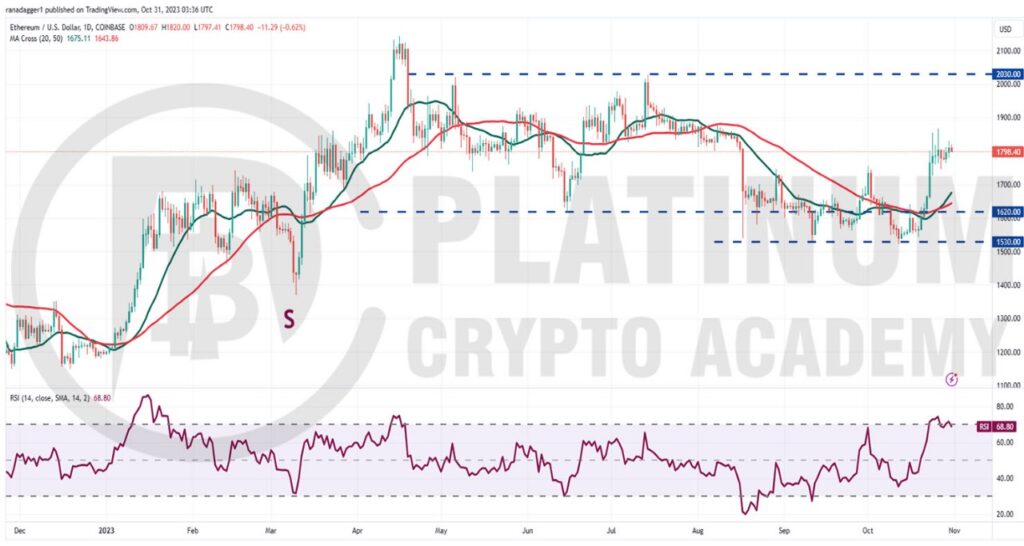
We said in the previous analysis that if bulls kick the price above the moving averages, Ether could rise to $1,755 and that was achieved on October 23.
The bulls continued their purchase and pushed the price to $1,866 on October 26. However, the long wick on the day’s candlestick shows that the bears are active at higher levels.
However, a positive sign is that fresh buying is taking place on minor dips. That has kept the ETH/USD pair stuck inside the tight range between $1,866 and $1,745 for the past few days.
If bulls clear the hurdle at $1,866, the pair may start the next leg of the up-move to $2,030. This level may act as a formidable resistance.
On the way down, if bears want to make a comeback, they will have to drag and sustain the price below $1,745. That could open the doors for a potential drop to the 20-day EMA.
BNB/USD Market Analysis
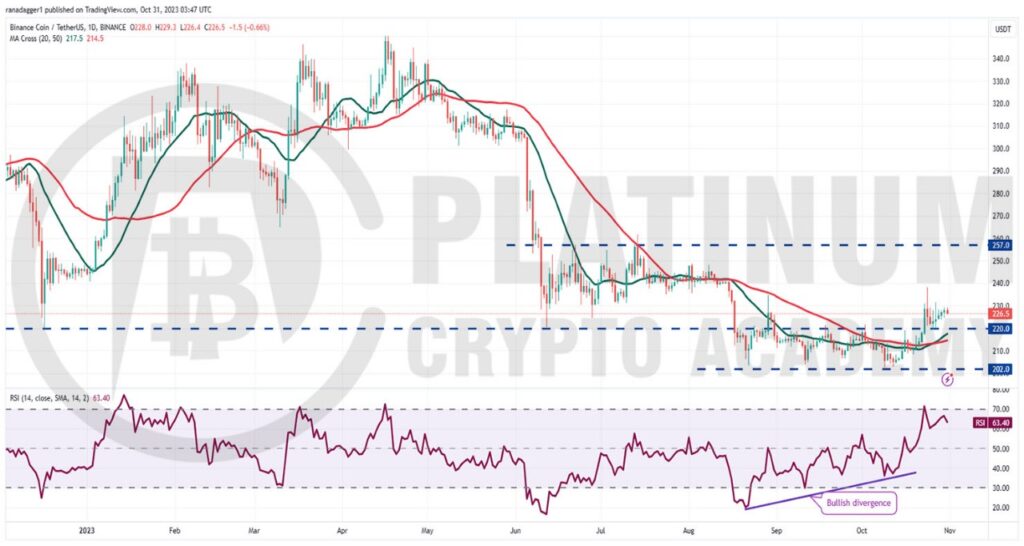
We highlighted in the previous analysis that Binance Coin could rally to $235 and that is what happened on October 24. However, the long wick on the day’s candlestick shows that the bulls booked profits at higher levels.
A positive sign for the bulls is that they successfully held the pullback to the breakout level of $200. This suggests that the bulls have flipped the level into support.
The upsloping 20-day EMA and the RSI near the overbought zone indicate that bulls are at an advantage. If they shove the price above $239, the BNB/USD pair could rally to $261.
This positive view could be invalidated in the near term if the price turns down and breaks below the moving averages. Such a move will suggest that the break above $220 may have been a bull trap.
XRP/USD Market Analysis
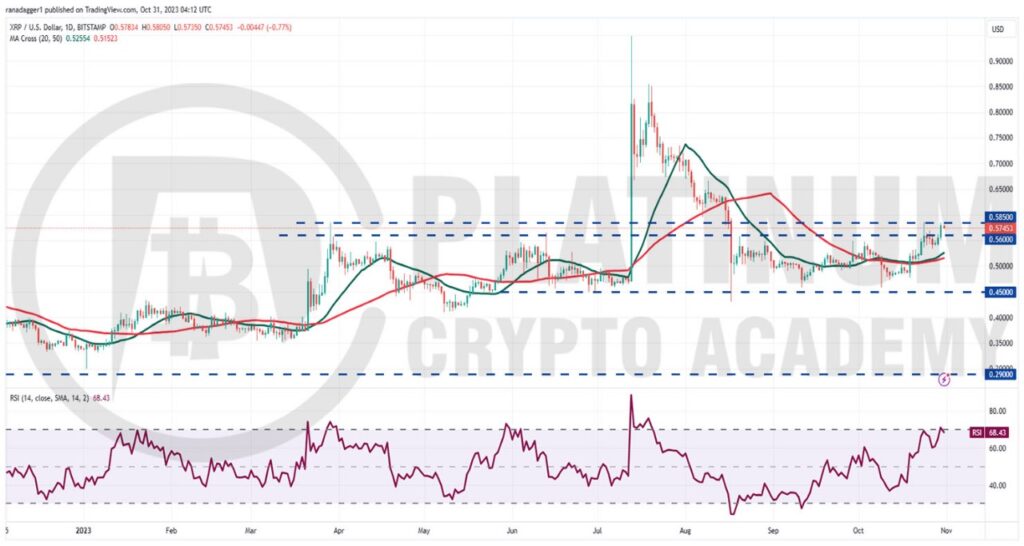
We mentioned in the previous analysis that if bulls drive the price above the moving averages, XRP could reach the overhead resistance at $0.56 and that is how it played out.
The XRP/USD pair rallied to $0.58 on October 24 but the bulls failed to clear this hurdle. However, on the way down, the bulls bought the dip and have again pushed the price to $0.58.
This remains the key level to keep an eye on in the short term. If this resistance is scaled, the pair may climb to $0.67 and subsequently sprint to $0.75.
The rising moving averages and the RSI near the overbought zone indicate that the path of least resistance is to the upside.
Contrary to this assumption, if the price turns down sharply from $0.58, it will suggest that the bears continue to aggressively defend the level. A break below the moving averages will suggest that the pair may extend its stay between $0.45 and $0.59 for some more time.
ADA/USD Market Analysis
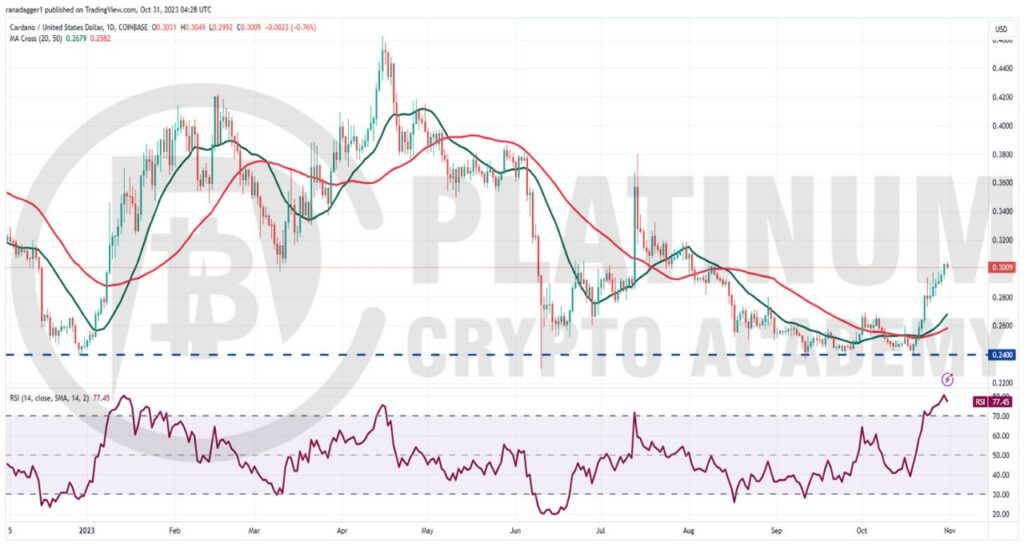
Sellers tried to sink Cardano below $0.24 on October 19 but the bulls held their ground. The repeated failure of the bears to break the $0.24 support attracted aggressive buying by the bulls.
The momentum picked up after the bulls pushed the price above the moving averages. The ADA/USD pair has reached $0.30 where the bears are facing selling by the bears.
A shallow pullback from the current level will suggest that the bulls are holding on to their positions as they anticipate another leg higher. If bulls overcome the obstacle at $0.30, the pair may jump to $0.34 and eventually to $0.38.
The risk to the upside move is the overbought levels on the RSI. This suggests that the markets are overheated in the near term. That may cause a correction to $0.28. The bears will have to yank the price below this level to signal a comeback.
Hopefully, you have enjoyed today’s article for further coverage please check out our crypto Blog Page. Thanks for reading! Have a fantastic day! Live from the Platinum Crypto Trading Floor.
Earnings Disclaimer: The information you’ll find in this article is for educational purpose only. We make no promise or guarantee of income or earnings. You have to do some work, use your best judgement and perform due diligence before using the information in this article. Your success is still up to you. Nothing in this article is intended to be professional, legal, financial and/or accounting advice. Always seek competent advice from professionals in these matters. If you break the city or other local laws, we will not be held liable for any damages you incur.
