
After a lackluster performance in January, Bitcoin picked up momentum in February and has risen about 22%, indicating aggressive buying by the bulls. CoinShares Digital Asset Fund Flows Weekly Report shows weekly inflows of $2.45 billion into digital asset investment products last week. This takes the total year-to-date inflows to $5.2 billion.
Data from market intelligence platform Santiment shows that the bigger whales, with wallets holding 1,000 to 10,000 Bitcoin, have purchased Bitcoin worth $12.95 billion in 2024. However, during the same time, the smaller whales, with wallets holding 100 to 1,000 Bitcoin, have been sellers worth $7.89 billion.
Apart from the robust Bitcoin ETF inflows, markets are excited about the forthcoming halving due on April 19. Historical data shows that Bitcoin rises about 32% in 60 days prior to the halving. If history repeats itself, then Bitcoin, which is trading near $52,000, could soar to its all-time highs by halving.
Analysts at AllianceBernstein also sent out a bullish note circulated to clients. They believe the markets have priced in the launch of the spot Bitcoin ETFs but the halving’s supply crunch has not yet been accounted for. The analysts said the ETF inflows are primarily driven by retail investors who have been Bitcoin believers. However, “in the coming days,” the ETFs will see investments from new Bitcoin enthusiasts. This will lead to fear of missing out (FOMO), propelling Bitcoin to new all-time highs in 2024.
Along with the long-term bullish picture, the medium-term story also looks positive. Bitcoin has risen for four consecutive weeks through Feb. 18. In the past five years, whenever Bitcoin has rallied for four straight weeks, it is followed by an average 49% gain over the following three months, according to Bloomberg data.
Will Bitcoin extend its up move and reach $60,000 in the next few days? Will altcoins also continue their move higher? Let’s study the charts to find out.
BTC/USD Market Analysis
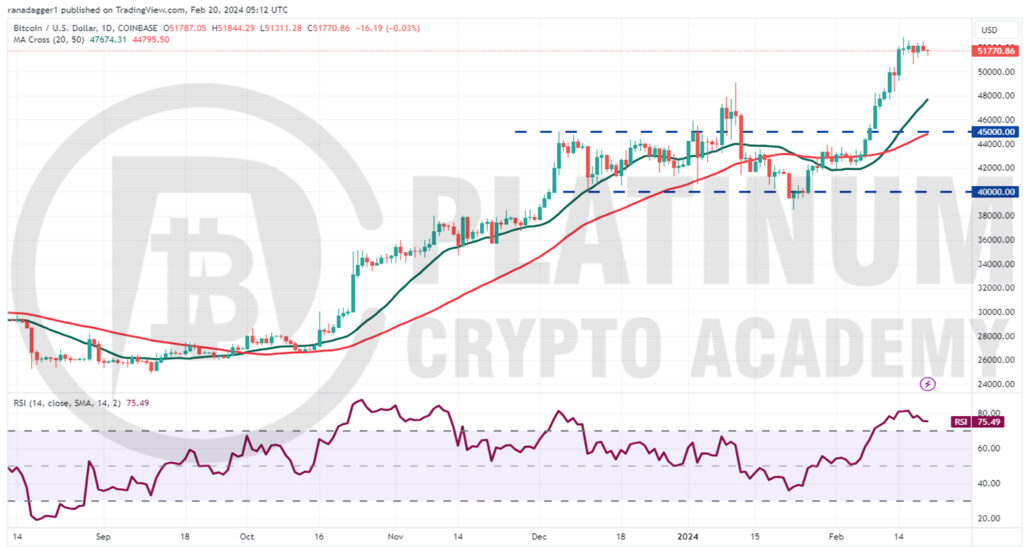
We said in the previous analysis that Bitcoin could pick up momentum after crossing $45,000 and that is what happened. The BTC/USD pair reached our expected target objective of $52,000 on February 14.
The bears are trying to halt the rally at $52,000, but a positive sign is that the bulls have not given up much ground. This suggests that the buyers are not hurrying to close their positions as they anticipate another leg higher.
If the price breaks and closes above $53,000, the pair could start the next leg of the uptrend. The pair may then climb to $60,000, which is likely to act as a stiff hurdle.
While the upsloping 20-day exponential moving average (EMA) indicates advantage to buyers, the relative strength index (RSI) in the overbought zone suggests that a minor correction or consolidation is possible.
If the price slips below $50,500, the next stop is the 20-day EMA. The bears will have to yank the price below the 20-day EMA to signal a short-term top. The pair could then plunge to $45,000.
ETH/USD Market Analysis
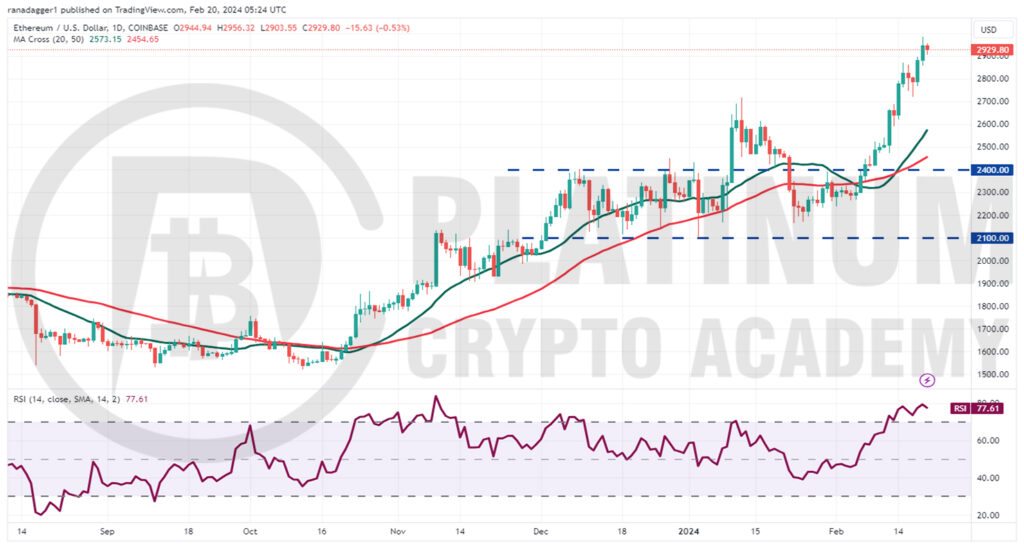
We highlighted in the earlier analysis that Ether’s bearish momentum was slowing down. We also said that if the ETH/USD pair broke above the moving averages, it could rise to $2,400 and subsequently to $2,700. All these levels played out the way we had anticipated.
The positive momentum broke above the $2,700 resistance on February 14 and the pair started its journey toward the psychologically important level of $3,000.
If the price turns down from $3,000 but rebounds off $2,700, it will signal that the bulls have flipped the level into support. That will increase the possibility of a rally to $3,500.
The risk for a further upside is the overbought level on the RSI. If the price turns down and breaks below the 20-day EMA, it will indicate that the bulls are rushing to the exit. That could start a further decline toward the strong support of $2,400.
BNB/USD Market Analysis
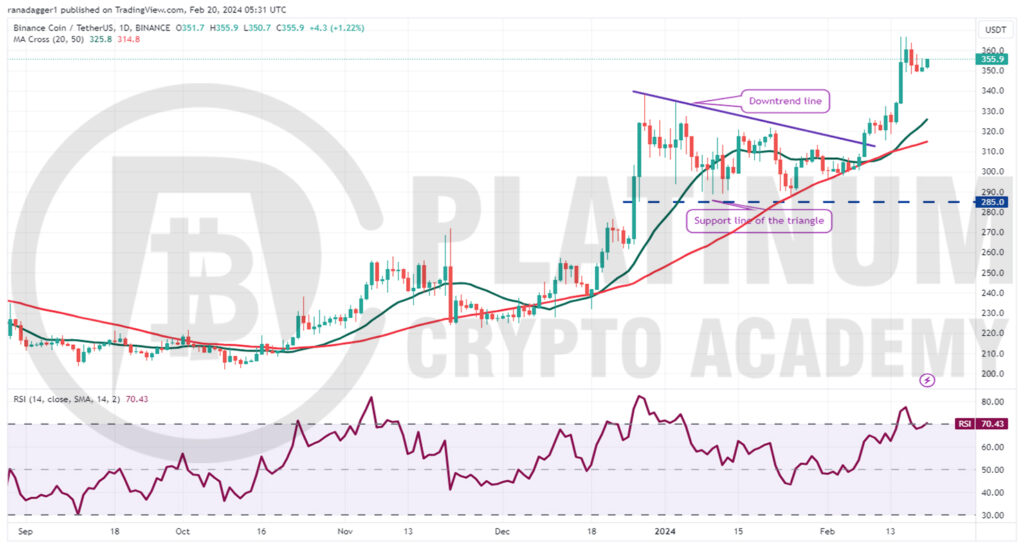
In the previous analysis, we projected Binance Coin to rally to $338 if bulls pushed the price above the downtrend line of the descending triangle pattern and that is how it behaved.
The bears were expected to mount a stiff resistance at $338, but the buyers bulldozed their way through. The BNB/USD pair is facing resistance near $360, but the bulls have not ceded ground to the bears. This suggests that the buyers anticipate the uptrend to continue.
If the price turns up from the current level and breaks above $367, it will indicate the resumption of the uptrend. The pair could then surge to $400. The upsloping 20-day EMA and the RSI in the overbought zone indicate that bulls remain in control.
This positive view will be invalidated if the price turns down sharply and breaks below the 50-day simple moving average (SMA). Such a move will suggest that the bulls are back in the game.
XRP/USD Market Analysis
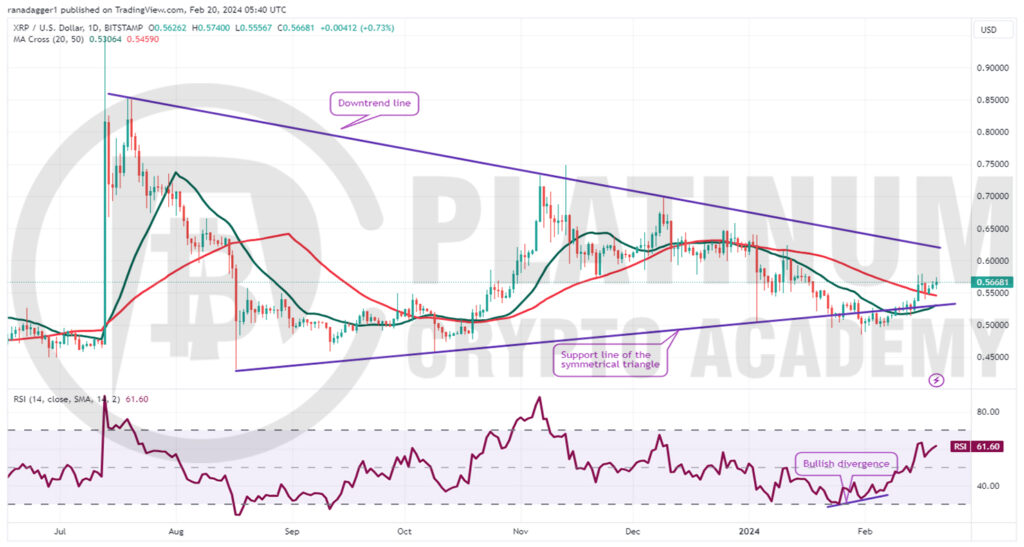
We cautioned traders in the previous analysis that XRP’s bullish divergence on the RSI indicated that the selling pressure was reducing. We also said that a break above the 20-day EMA could open the doors for a rally to the 50-day SMA and that is how it played out.
The 20-day EMA has started to turn up gradually and the RSI is in the positive territory, indicating a minor advantage to buyers. If the price rises above $0.58, the pair could reach the downtrend line.
A break and close above the downtrend line will indicate the start of the next leg of the up move. The pair could then attempt a rally to $0.70 and later to $0.75.
Contrarily, if the price turns lower from the downtrend line, it will signal that the bears continue to defend it with vigor. That could keep the pair stuck inside the triangle for some more time.
On the downside, a break and close below the triangle could sink the pair to the January 31 intraday low of $0.48.
ADA/USD Market Analysis
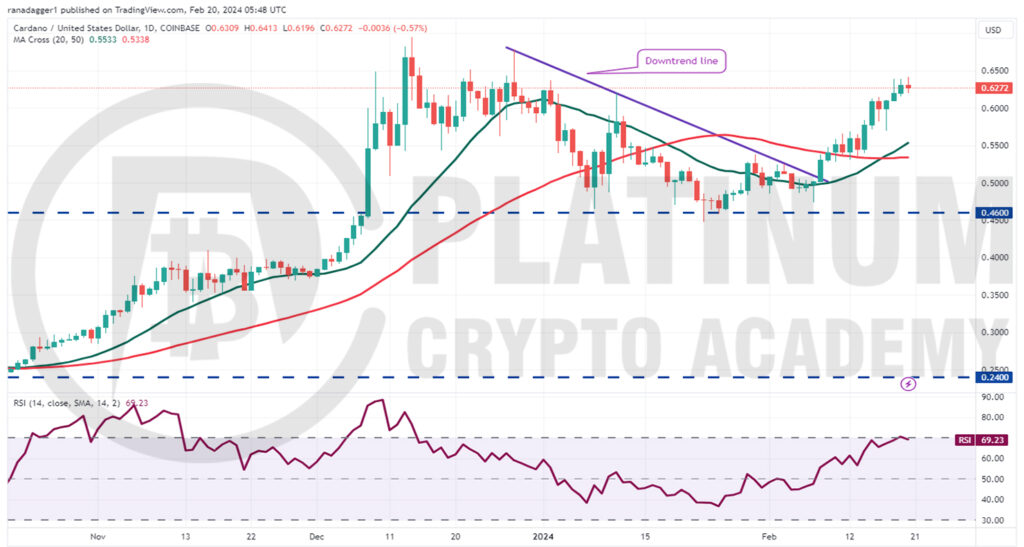
We said a break and close above the downtrend line could drive Cardano to the 50-day SMA and thereafter to $0.62 and that is what happened.
The moving averages have completed a bullish crossover and the RSI has risen near the overbought zone, indicating that the bulls are in command.
However, the bears are unlikely to give up easily. They will try to pose a strong challenge in the zone between $0.64 and $0.70. If bulls do not give up much ground from the overhead zone, it will increase the possibility of a break above it. If that happens, the ADA/USD pair could reach $0.90.
The 20-day EMA is the important support to watch out for on the downside. A break and close below the 20-day EMA could indicate that the pair may swing between $0.46 and $0.70 for a few more days.
Hopefully, you have enjoyed today’s article for further coverage please check out our crypto Blog Page. Thanks for reading! Have a fantastic day! Live from the Platinum Crypto Trading Floor.
Earnings Disclaimer: The information you’ll find in this article is for educational purpose only. We make no promise or guarantee of income or earnings. You have to do some work, use your best judgement and perform due diligence before using the information in this article. Your success is still up to you. Nothing in this article is intended to be professional, legal, financial and/or accounting advice. Always seek competent advice from professionals in these matters. If you break the city or other local laws, we will not be held liable for any damages you incur.
