
Bitcoin has been oscillating inside a large range between $25,000 and $31,050 for the past several months. In a well-defined range, traders generally buy at the support and sell close to the resistance and that is what was seen in Bitcoin. The price rebounded sharply off $25,000, indicating that the range remains intact and traders are buying near the support.
The drop to $25,000 happened on fears that a US court may permit liquidators to sell crypto assets of bankrupt exchange FTX and its sister concern Alameda Research. FTX holds about $3.4 billion in crypto assets with Solana being the biggest position worth $1.16 billion. It also holds $560 million in Bitcoin and $192 million in Ether. However, the markets remained calm after the court gave the said permission on September 13.
Another event that may boost volatility in the near term is the Federal Reserve’s meeting on September 20. The CME FedWatch Tool projects a 98% probability of the Fed holding rates steady during the meeting. However, market observers will be keenly watching the Fed’s press conference following the meeting for insights about future rate hikes. Any surprise could lead to a knee-jerk reaction in the near term.
Several analysts believe that the Fed will have to keep interest rates higher for longer to curb stubborn inflation. Jamie Coutts, a chartered market technician and crypto market analyst at Bloomberg Intelligence warned during a recent interview that if unemployment ticks up and banks come under more stress, “then there could be a bit more pain for risk assets like Bitcoin.”
In contrast, long-term crypto bull Anthony Pompliano said in an interview with Fox Business that Bitcoin is on the cusp of a bull market. He believes that the expected greenlighting of the Bitcoin spot exchange-traded fund applications will provide the “demand shock” and the Bitcoin halving will act as a “supply shock”, boosting prices higher.
Could Bitcoin and the major altcoins extend their recovery in the near term? Let’s study the charts of Bitcoin and the major altcoins to find out.
BTC/USD Market Analysis
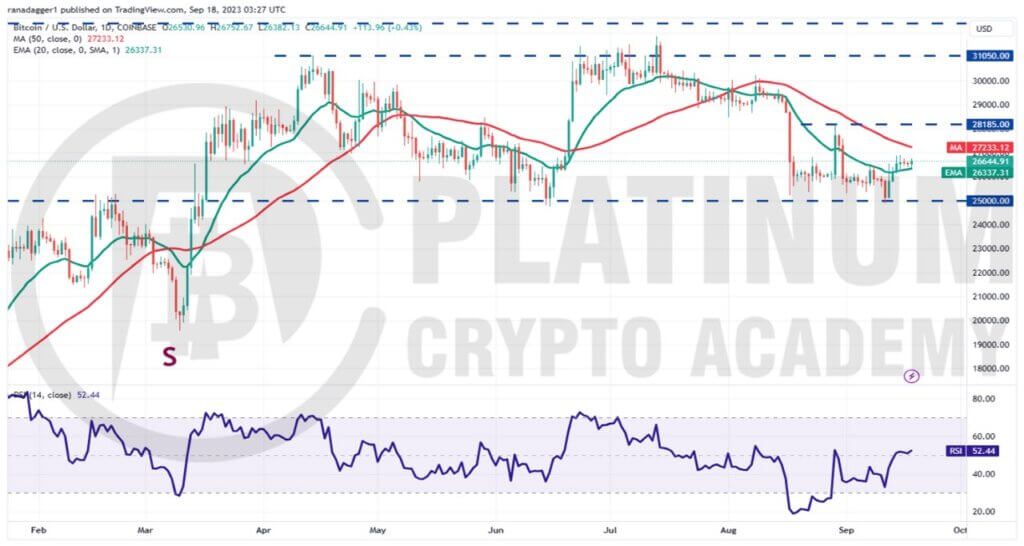
We said in the previous analysis that the bulls are expected to defend the $25,000 level with all their might and they did just that on September 13. This indicates that Bitcoin remains stuck inside the large range between $25,000 and $31,050.
The bulls pushed the price above the 20-day exponential moving average (EMA) on September 14 but failed to challenge the 50-day simple moving average (SMA). This suggests a lack of demand at higher levels.
The bears tried to sink the price back below the 20-day EMA but the bulls held their ground. This shows that the bulls are trying to flip the 20-day EMA into support.
If they do that, the BTC/USD pair could climb to the 50-day SMA. This level may again act as a strong hurdle but if cleared, the pair could reach $28,185. If the price turns down sharply from this level, it will indicate that the pair may consolidate between $25,000 and $28,185 for a few more days.
The positive view will invalidate in the near term if the price slips back below the 20-day EMA. That will embolden the bears who will again take a shot at the crucial support at $25,000. If this level cracks, the pair may collapse to $20,000.
ETH/USD Market Analysis
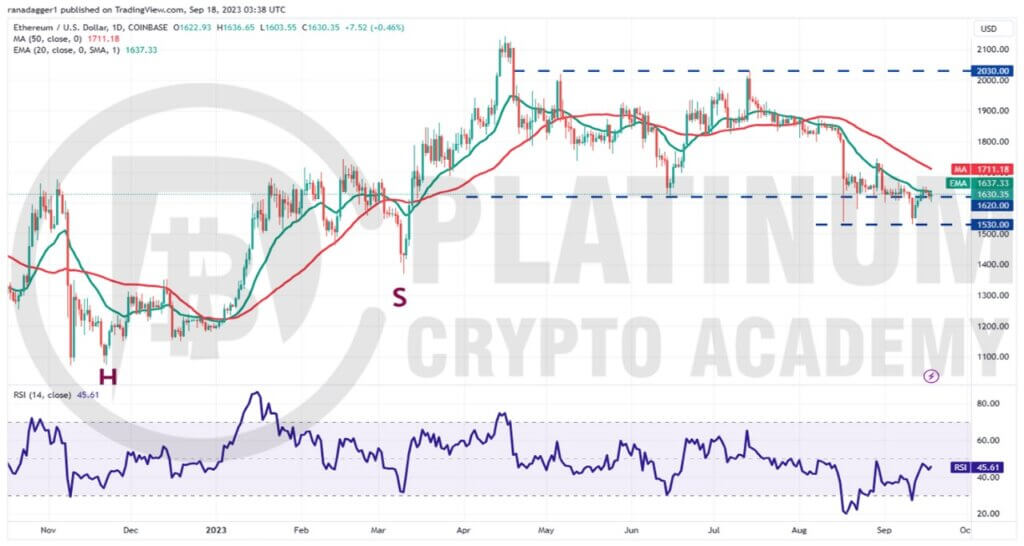
We warned traders in the previous analysis that the likelihood of a drop below $1,620 was high and the level gave way on September 10. Ether retested the August 17 intraday low of $1,540 on September 11.
The bulls purchased this dip, indicating that lower levels continue to attract buyers. The price has reached the 20-day EMA, which is acting as a strong resistance.
A minor positive in favor of the bulls is that they have not given up much ground from the 20-day EMA. This suggests that traders anticipate the recovery to continue above the 20-day EMA.
If this level is scaled, the ETH/USD pair could reach the stiff overhead resistance at $1,746. If the price turns down from this level but bounces off the 20-day EMA, it will suggest that the sentiment has turned positive. That will enhance the prospects of a rally to $1,900.
The crucial support to watch on the downside is $1,530. If this level cracks, the pair may plummet to $1,369.
BNB/USD Market Analysis
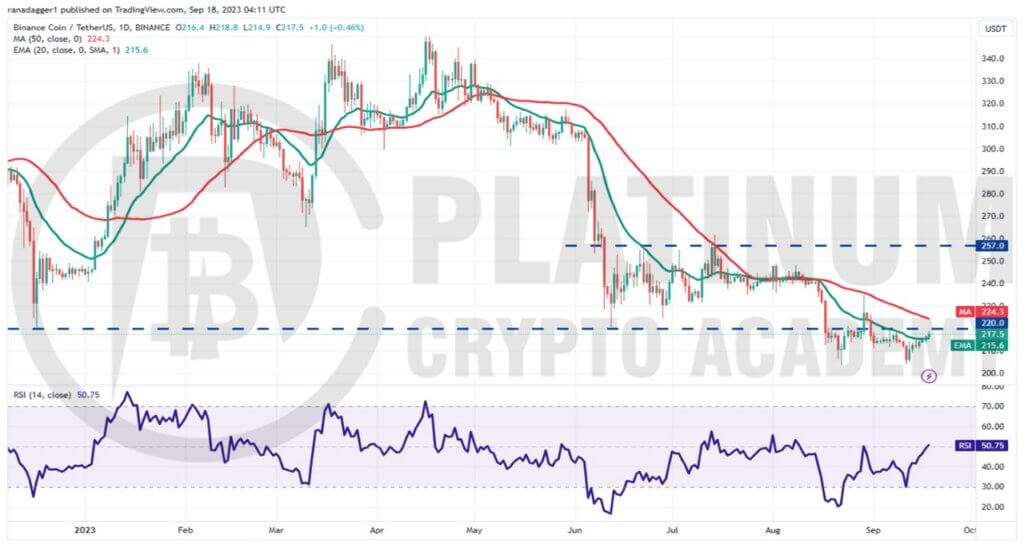
The bears pulled Binance Coin near the psychological support of $200 on September 11 but they could not tug the price below it. This shows that the bulls are aggressively defending the level.
The relief rally has reached the breakdown level of $220, which is an important level to keep an eye on. If buyers kick the price above the 50-day SMA, it will indicate the start of a stronger recovery. The BNB/USD pair could then reach $235.
This level may again act as a barrier but if overcome, the pair could continue its up-move toward $257.
Contrary to this assumption, if the price turns down from the 50-day SMA, it will indicate that bears remain active at higher levels. That will increase the possibility of a break below $200. The pair could then plunge to the next major support at $183.
XRP/USD Market Analysis
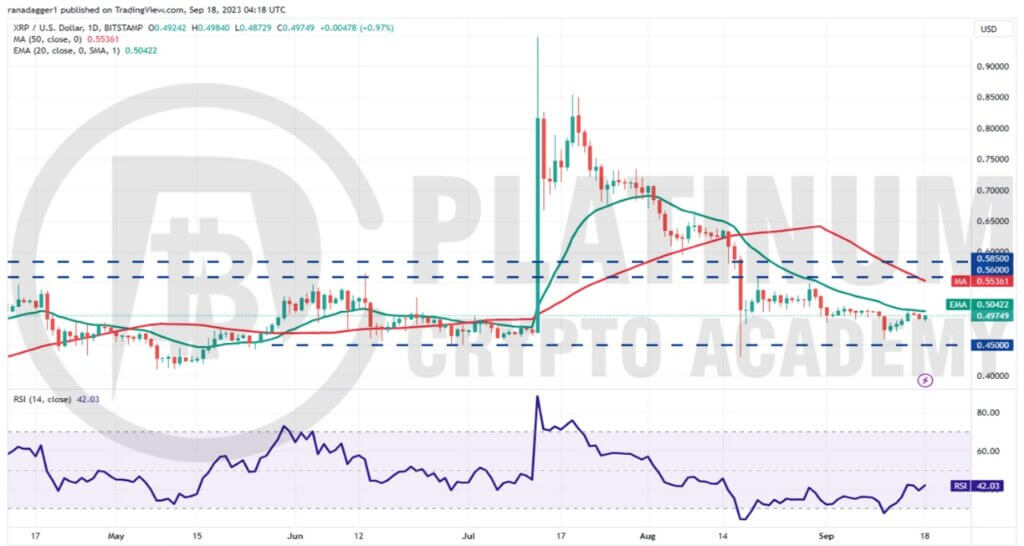
We said in our previous analysis that XRP could drop to $0.45 and this level was likely to witness solid buying by the bulls and that is how it played out.
XRP reached the 20-day EMA on September 15 but the bulls failed to surmount this level. This shows that the bears are defending the 20-day EMA with vigor.
However, an advantage in favor of the bulls is that they have not ceded ground to the bears. This suggests that the bulls anticipate the XRP/USD pair to move higher.
A break and close above the 20-day EMA could open the doors for a potential rise to $0.56. This level may again prove to be a major roadblock.
On the downside, the bears will have to sink and sustain the price below $0.45 to start the next leg of the downtrend to $0.40.
ADA/USD Market Analysis
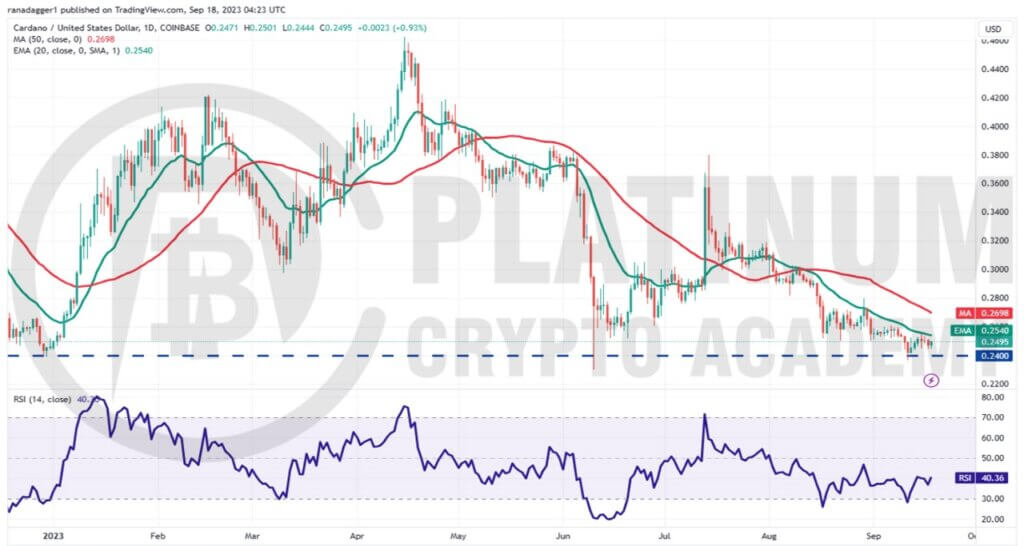
We mentioned in our previous analysis that the support at $0.24 is likely to be tested and that happened on September 11. The bulls held the level and started a relief rally which is facing strong selling at the 20-day EMA.
The downsloping moving averages indicate advantage to bears but the positive divergence on the relative strength index (RSI) suggests that the bearish momentum is weakening. This enhances the prospects of a rally above the 20-day EMA.
The ADA/USD pair could then rise to the 50-day SMA and later to the overhead resistance at $0.28. This remains the key level for the bears to defend if they want to maintain their supremacy.
If the $0.28 level is conquered, the pair could surge to $0.30 and eventually to $0.32.
Contrarily, a break and close below $0.24 could signal the resumption of the downtrend. The pair could then dive to $0.22.
Hopefully, you have enjoyed today’s article for further coverage please check out our crypto Blog Page. Thanks for reading! Have a fantastic day! Live from the Platinum Crypto Trading Floor.
Earnings Disclaimer: The information you’ll find in this article is for educational purpose only. We make no promise or guarantee of income or earnings. You have to do some work, use your best judgement and perform due diligence before using the information in this article. Your success is still up to you. Nothing in this article is intended to be professional, legal, financial and/or accounting advice. Always seek competent advice from professionals in these matters. If you break the city or other local laws, we will not be held liable for any damages you incur.
