
BlackRock, the world’s biggest asset manager, filed for a spot Bitcoin exchange-traded fund on June 15. Similar applications were filed by WisdomTree and Invesco on June 20. Cryptocurrency fund manager Valkyrie added to the rush with a filing on June 21. There are rumors that Fidelity may also follow suit.
These filings gave a boost to the cryptocurrency sector because some believe that if an ETF is approved, it could attract investors who may want exposure to Bitcoin but are uncomfortable buying it. The flurry of applications triggered an inflow of $199 million in digital asset investment products, the largest weekly inflow since July 2022, according to CoinShares’ weekly report. Bitcoin behaved positively, rising from $24,750 on June 15 to hit a 52-week high of $31,444 on June 23.
Many believe that the US Securities and Exchange Commission (SEC) may approve BlackRock’s application. However, risks remain because the SEC has rejected about 30 such previous attempts for a spot-Bitcoin product, citing fraud and manipulation risks. A rejection of the latest set of applications may crush investor sentiment, resulting in a sell-off.
Meanwhile, Bitcoin’s bullishness has rubbed on to Ether and several other altcoins, which have risen from their slumber. Glassnode data shows that Ether’s exchange balances hit a new low of 12.6% after dropping sharply in the past 30 days. A similar fall in exchange balances occurred in November 2022, which was followed by a sharp 33% rally.
A fall in exchange balances is considered a positive sign because it indicates the availability of fewer coins to sell in the near term. However, traders need to be cautious because a large part of Ether withdrawals in early June may have been due to the regulatory action on Binance and Coinbase by the SEC.
Could bulls maintain the buying pressure in the next few days or will they book profits and lock in the recent gains? Let’s study the charts of Bitcoin and the major altcoins to find out.
BTC/USD Market Analysis
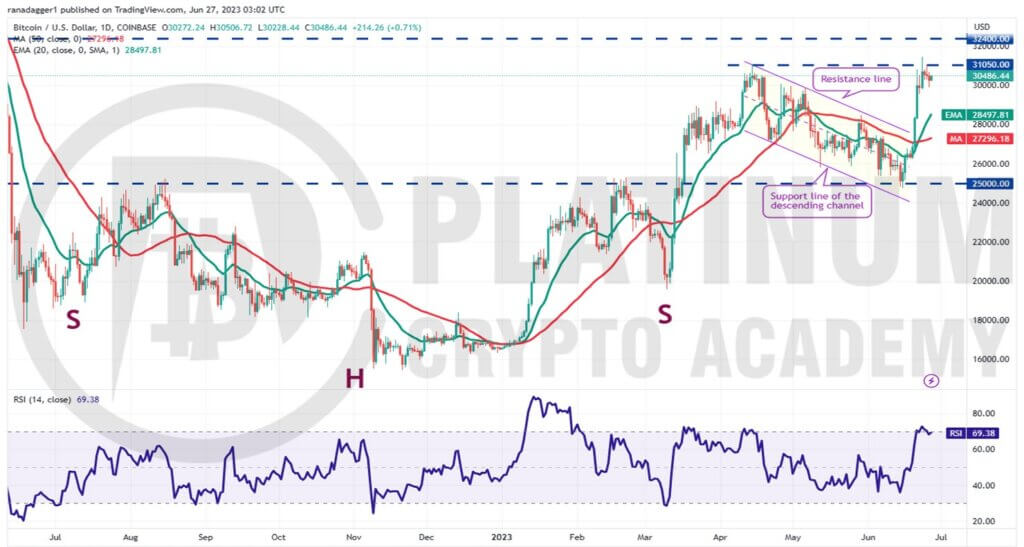
Bitcoin bounced off the $25,000 support on June 15 and soared above the descending channel on June 20. This indicated the end of the corrective phase.
The momentum picked up further and the bulls pushed the price above the overhead resistance at $31,050 on June 23. However, the bears are not willing to give up and are fiercely defending this level.
A minor positive in favor of the bulls is that they are not rushing to the exit. This suggests that buyers are expecting a move above $31,050. If that happens, the BTC/USD pair may start the next leg of the up-move.
There is a minor resistance at $32,400 but it may not hold the rally for long. If this level is scaled, the pair may surge to $40,000 as there is no major resistance in between.
The upsloping 20-day exponential moving average (EMA) and the relative strength index (RSI) in the positive territory also indicate that the path of least resistance is to the upside.
The first sign of weakness will be a break and close below the immediate support of $29,500. That could result in a decline to the 20-day EMA. If this support cracks, it will suggest that the pair may oscillate inside the large range between $31,050 and $25,000 for a while longer.
ETH/USD Market Analysis
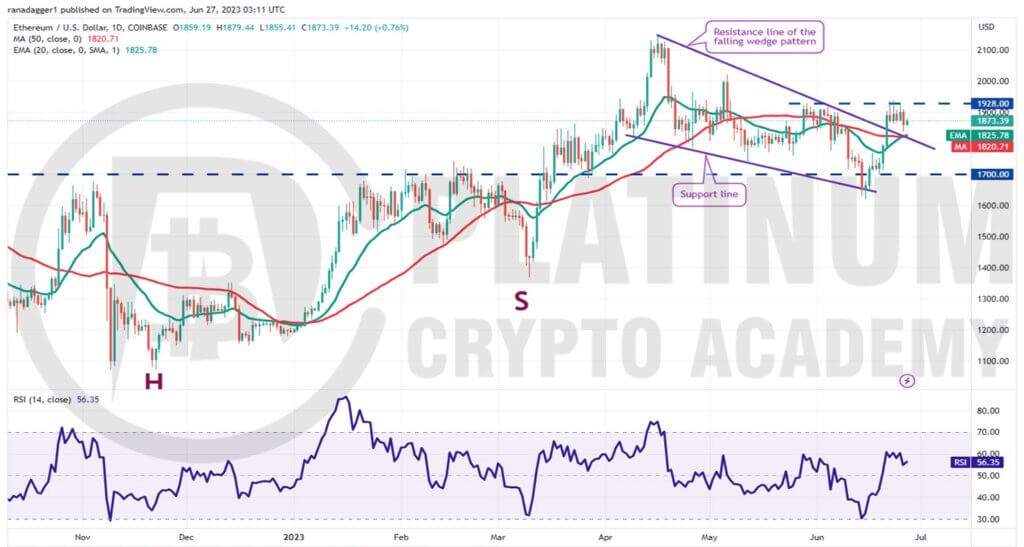
The bears pulled Ether below the support line of the wedge on June 14 and 15 but they could not sustain the lower levels. Aggressive buying by the bulls started a recovery which rose above the wedge on June 21.
Buyers tried to extend the gains above the immediate resistance at $1,928 but the bears did not relent.
The bulls are buying the dips to the moving averages and the bears are selling on rallies near $1,928. This narrow-range trading is unlikely to continue for long.
If the price plummets below the moving averages, it will suggest that short-term bulls may have thrown in the towel. The pair could then retest the vital support zone between $1,700 and $1,620.
Alternatively, a break and close above $1,928 could start a new up-move. The $2,000 level may prove to be a strong hurdle but it is likely to be crossed. The pair may then rally to $2,143.
BNB/USD Market Analysis
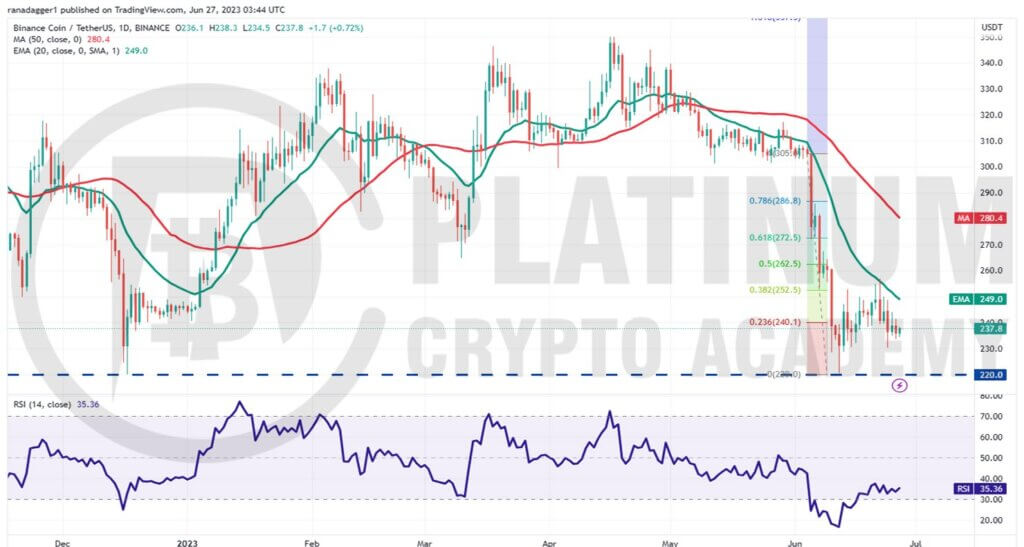
Binance Coin remains in a downtrend. The bulls are trying to protect the support at $220 but they have failed to propel the price above the 20-day EMA. This suggests that the sentiment remains negative and traders are selling on rallies.
The important support to watch on the downside is $220. If this level cracks, it will signal the resumption of the downtrend. The BNB/USD pair could first descend to the psychological level of $200 and thereafter to $183.
If bulls want to prevent the decline, they will have to quickly drive the price above $257. The pair could then rise to the 61.8% Fibonacci retracement level of $272.
The bears will again try to stall the rally at this level but if buyers overcome this barrier, the pair may complete a 100% retracement and rise to $305.
XRP/USD Market Analysis
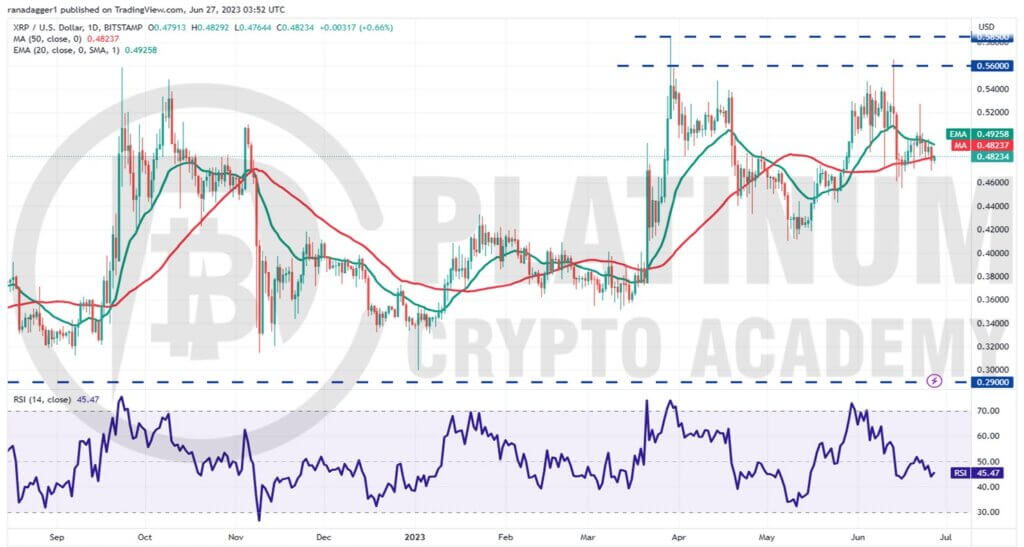
The bulls pushed XRP above the overhead resistance of $0.56 on June 13 but they could not sustain the breakout. That may have tempted short-term bulls to book profits and aggressive bears to initiate short positions.
That pulled the price to the 50-day SMA on June 14. The bulls have been defending the 50-day SMA for the past few days but a negative sign is that they have not been able to clear the barrier at the 20-day EMA. This suggests that the bears are selling on every minor rally.
The XRP/USD pair has been stuck between the moving averages for the past few days. Generally, tight ranges are followed by a range expansion.
In this case, if bulls drive and sustain the price above the 20-day EMA, the pair may attempt a rally to the overhead zone between $0.56 and $0.58.
Contrarily, if bears sink and sustain the price below the 50-day SMA, the pair may plummet to $0.44 and subsequently to $0.41.
ADA/USD Market Analysis
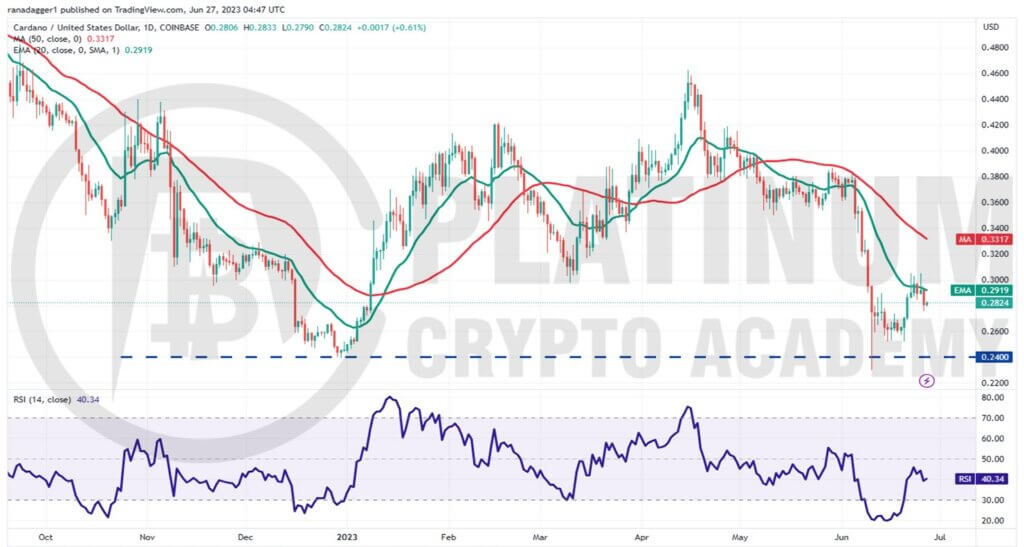
Cardano rebounded off the strong support of $0.24 on June 10 but the bulls could not clear the hurdle at the 20-day EMA. This suggests that bears continue to sell on relief rallies.
The 20-day EMA has started to turn down and the RSI is in the negative territory, indicating advantage to sellers. The bears will try to sink the price to the crucial support at $0.24.
This remains the key level to keep an eye on because a break and close below it may indicate the start of the next leg of the downtrend. The ADA/USD pair may then nosedive to $0.20.
This negative view will invalidate in the near term if the price turns up from the current level and sustains above the 20-day EMA. That may open the doors for a rally to the 50-day SMA.
Hopefully, you have enjoyed today’s article for further coverage please check out our crypto Blog Page. Thanks for reading! Have a fantastic day! Live from the Platinum Crypto Trading Floor.
Earnings Disclaimer: The information you’ll find in this article is for educational purpose only. We make no promise or guarantee of income or earnings. You have to do some work, use your best judgement and perform due diligence before using the information in this article. Your success is still up to you. Nothing in this article is intended to be professional, legal, financial and/or accounting advice. Always seek competent advice from professionals in these matters. If you break the city or other local laws, we will not be held liable for any damages you incur.
