
The cryptocurrency markets are buzzing with the possibility that one or more spot Bitcoin exchange-traded fund (ETF) applications will be approved by the United States Securities and Exchange Commission (SEC) by January 10. Bloomberg senior ETF analyst Eric Balchunas gives a 95% probability of the ETF approval by the regulator.
Balchunas is not the only one showing confidence. Former SEC chair Jay Clayton said in an interview with CNBC on January 8 that the “approval is inevitable. There’s nothing left to decide.”
Although the ETF approval is a momentous occasion for the crypto markets, what will be the impact on Bitcoin’s price? Analysts are divided on the short-term reaction because some expect the uptrend to continue, but others anticipate the approvals to result in profit-booking by traders in a classic case of buy the rumor and sell the news. However, most believe that its long-term impact will be hugely bullish for Bitcoin.
Standard Chartered Head of FX Research Geoff Kendrick said in a note on January 8 that Bitcoin ETF approvals could attract massive inflows, boosting Bitcoin’s price to $200,000 by the end of next year. Kendrick arrived at the outlook by drawing a parallel with the first gold ETF product, which surged fourfold in seven years. For Bitcoin, the analyst expects the Bitcoin ETF market to mature more quickly and realize the gains within a short one- to two-year period.
The Bitcoin ETF approval will raise hopes that Ethereum ETFs may also be greenlighted by the regulator in the future, boosting the price of Ether and select altcoins.
Bitcoin and the cryptocurrency markets are upbeat on the possibility of spot Bitcoin ETF approvals, but SEC chair Gary Gensler cautioned investors in a X (formerly Twitter) thread about the risks in crypto investing.
Could Bitcoin and major altcoins start the next leg of the uptrend? What are the important levels to watch out for? Let’s study the charts to find out.
BTC/USD Market Analysis
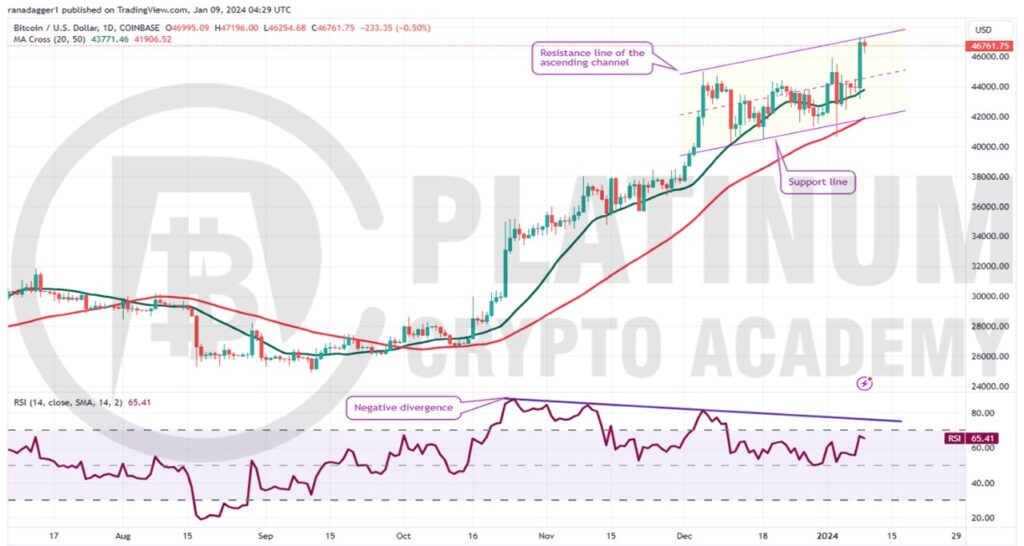
Bitcoin is trading inside an ascending channel pattern. The bulls reasserted their supremacy with a sharp up-move above the $45,925 resistance on January 8. This propelled the price to the resistance line of the channel, which is likely to act as a minor hurdle.
The upsloping moving averages indicate advantage to buyers, but the negative divergence on the relative strength index (RSI) cautions that the bullish momentum may be weakening.
However, if the price rises above the channel, it will indicate that the bulls remain in control. The BTC/USD pair could rally to the psychological level of $50,000 and then to $52,000. Sellers are likely to mount a strong defense at this level, but the uptrend could extend to $60,000 if bulls prevail.
Contrary to this assumption, if the price turns down from the current level, it will suggest that bears remain active at higher levels. The pair may drop to the 20-day exponential moving average (EMA), an important level to watch out for.
If the price rebounds off the 20-day EMA, it will indicate that the sentiment remains bullish and traders are buying on dips. That will increase the likelihood of a rally above the channel.
If bears want to prevent the upside, they will have to drag the pair below the 20-day EMA. That may open the doors for a fall to the support line of the channel.
ETH/USD Market Analysis
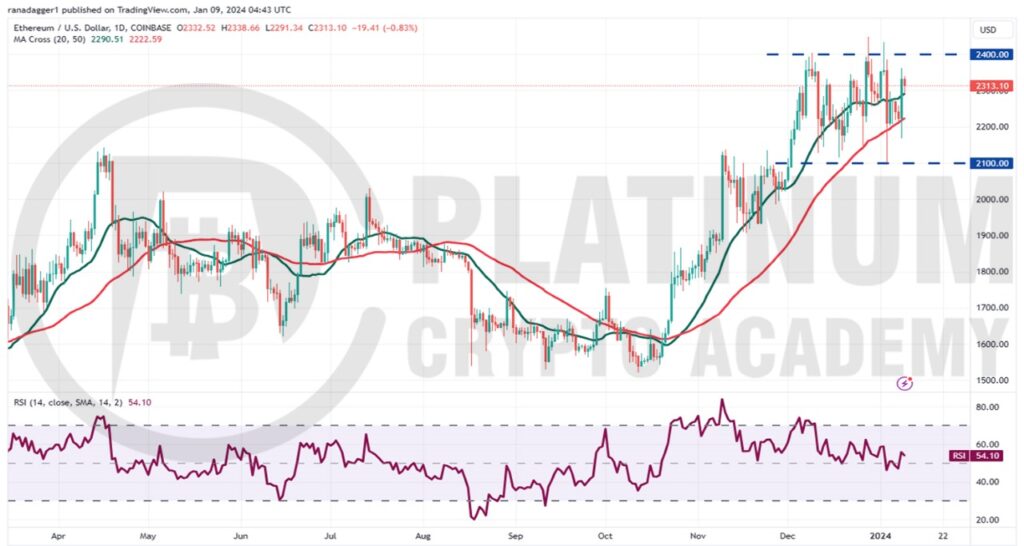
Ether has been range-bound between $2,100 and $2,400 for the past several days, indicating indecision between the bulls and the bears about the next directional move.
The upsloping moving averages signal a minor advantage to buyers, but the RSI near the midpoint suggests that the positive momentum has weakened. If the price turns down and breaks below the 20-day EMA, the ETH/USD pair may remain inside the range for a few more days.
The first sign of strength will be a break and close above $2,400. That will indicate the start of the next leg of the uptrend. The pair may then climb to the pattern target of $2,700 and later dash to the psychological level of $3,000.
This positive view will be invalidated if the price turns down and breaks below the channel at $2,100.
BNB/USD Market Analysis
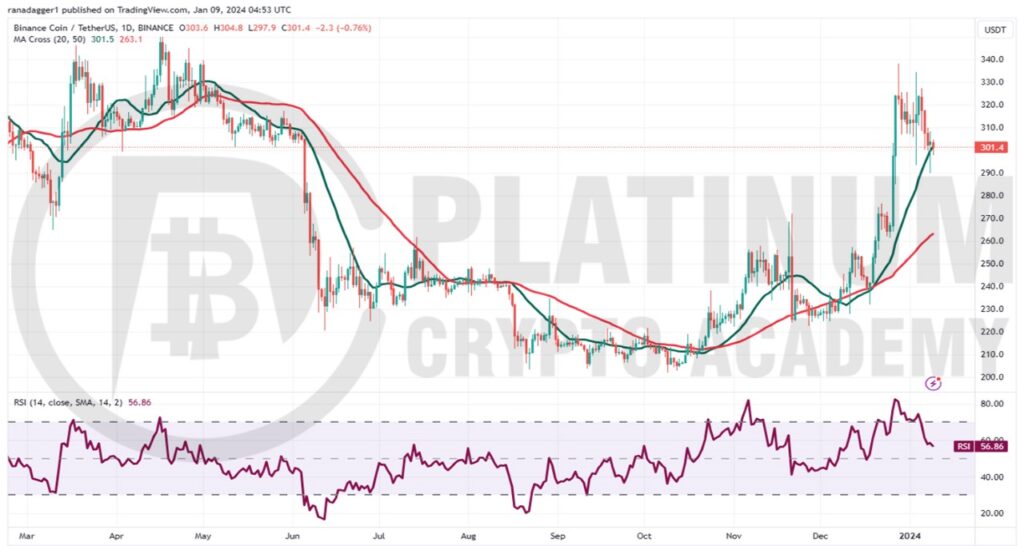
Binance Coin is correcting in an uptrend. The bears pulled the price below the 20-day EMA on January 8, but the long tail on the candlestick shows solid buying at lower levels.
The upsloping 20-day EMA and the RSI just above the midpoint give a slight edge to the bulls. If the price turns up from the 20-day EMA, the pair could rise to $338 and consolidate inside this range for a few days.
The BNB/USD pair will resume the uptrend if buyers kick the price above the overhead resistance of $350. The pair could then soar toward $400.
Contrarily, if the price slips and sustains below the 20-day EMA, it will suggest that the bulls are booking profits in a hurry. A break below the $290 support may intensify selling, and the pair could slump to the 50-day simple moving average (SMA).
XRP/USD Market Analysis
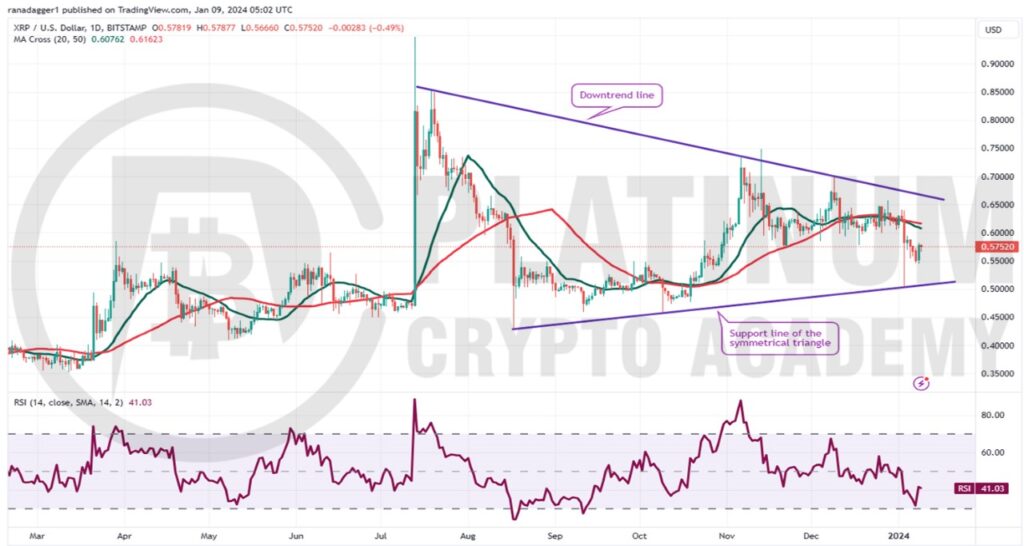
XRP’s price action over the past few days has formed a symmetrical triangle pattern, indicating uncertainty between the buyers and sellers. It is always tricky to predict the direction of the breakout from the triangle. Hence it is better to wait for the break to happen before initiating large bets.
The 20-day EMA has started to turn down, and the RSI is in the negative territory, signaling a minor advantage to the bears. The pair could drop to the support line of the triangle, which is likely to attract buyers.
If the price rebounds off the support line, the XRP/USD pair may remain inside the triangle for a while longer.
The pair will turn bullish after the price breaks and sustains above the triangle. That could start a new uptrend to $0.75 and thereafter to $0.85. The pattern target of this setup is $1.08.
ADA/USD Market Analysis
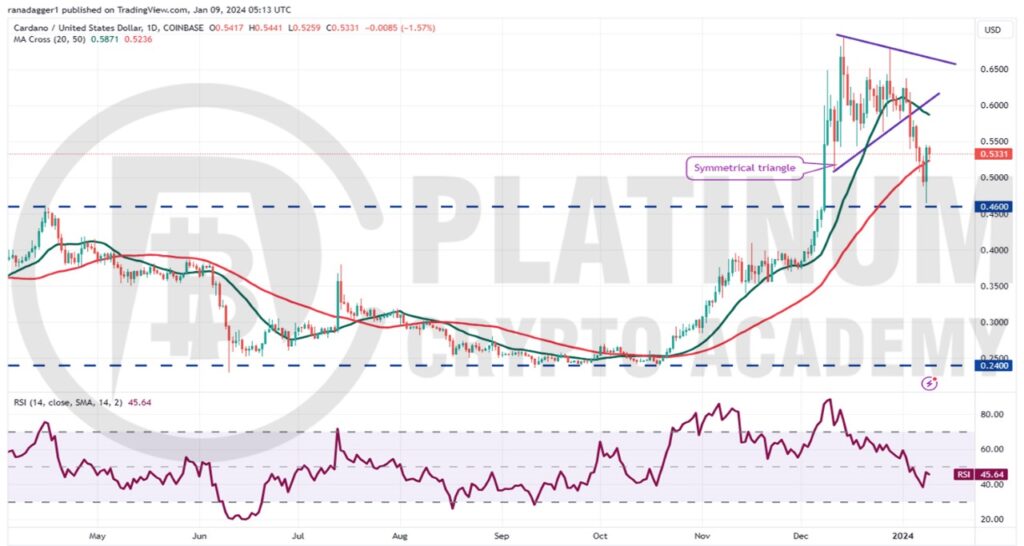
Cardano turned down sharply after breaking below the symmetrical triangle pattern on January 3. The price dropped to $0.46 on January 8, but the sharp rebound suggests that the bulls are trying to flip the level into support.
Any recovery attempt is likely to face selling at the 20-day EMA. If the price turns down from the 20-day EMA, it will suggest that the sentiment has turned negative and traders are selling on rallies. The ADA/USD pair may then swing between the 20-day EMA and $0.46 for some time.
The first sign of strength will be a break and close above the 20-day EMA. Such a move will suggest that the corrective phase may be over. The pair may then climb to $0.64 and subsequently to $0.70.
On the downside, the selling could intensify if the $0.46 support cracks. That could plunge the pair to $0.40 and eventually to $0.35.
Hopefully, you have enjoyed today’s article for further coverage please check out our crypto Blog Page. Thanks for reading! Have a fantastic day! Live from the Platinum Crypto Trading Floor.
Earnings Disclaimer: The information you’ll find in this article is for educational purpose only. We make no promise or guarantee of income or earnings. You have to do some work, use your best judgement and perform due diligence before using the information in this article. Your success is still up to you. Nothing in this article is intended to be professional, legal, financial and/or accounting advice. Always seek competent advice from professionals in these matters. If you break the city or other local laws, we will not be held liable for any damages you incur.
