
The United States Securities and Exchange Commission (SEC) expanded its regulatory crackdown on the cryptocurrency sector by unleashing lawsuits against Binance on June 5 and Coinbase on June 6. In the lawsuit, the SEC has labeled 23 cryptocurrencies as securities, taking the total number of cryptocurrencies named as securities to 67.
The regulator has charged Binance and its founder Changpeng Zhao with 13 offenses, including mishandling customer funds and illegally serving US investors. The charges against Coinbase are for illegally operating an unregistered securities exchange. Both the lawsuits are an attempt by the SEC to bring cryptocurrencies under the jurisdiction of the federal securities laws. This increases uncertainty in the short term and could keep institutional investors at bay until clarity emerges.
Following the lawsuit, popular trading platform Robinhood announced that it will end support for Cardano, Solana, and Polygon on June 27. All these three tokens were named as securities in the recent lawsuits brought about by the SEC. This resulted in a sharp fall in all three altcoins.
Apart from the crypto-specific issues, the market observers will keep a close eye on the US consumer price index data due to be released on June 13 and the outcome of the Federal Reserve’s policy meeting on June 14. The FedWatch Tool projects an 84% probability of a pause by the Fed on Wednesday. If that happens, the risk-on sentiment might improve, limiting the downside in the crypto markets.
Among all the chaos, there is a ray of hope for the crypto investors as Bitcoin has not plunged below its vital support of $25,000. This shows that institutional investors are not dumping their holdings in panic. On the contrary, behavior analytics platform Santiment said on June 11 that Bitcoin whales have been buying roughly 1,000 Bitcoin every day since April 9. Although Bitcoin is down about 10% during the period, Bitcoin whales have accumulated an additional 57,578 Bitcoin.
What are the important support levels to watch out for? Let’s study the charts of Bitcoin and the major altcoins to find out.
BTC/USD Market Analysis
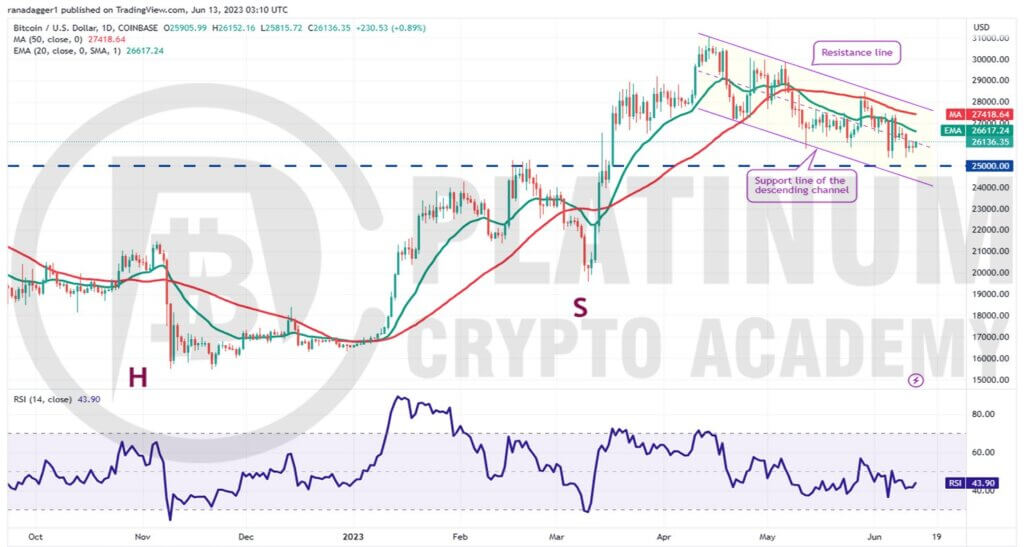
The bears repeatedly tried to sink Bitcoin below the critical support of $25,000 in the past few days but the bulls held their ground. This shows strong buying near $25,000, making it an important level to watch out for in the near term.
Buyers will try to start a recovery by pushing the price above the 20-day exponential moving average (EMA). If they manage to do that, it will signal that the selling pressure is reducing. The BTC/USD pair may then attempt a rally to the resistance line of the descending channel pattern.
If the price turns down from the resistance line, it will suggest that the pair may spend some more time inside the channel. Alternatively, a break above the channel will indicate the end of the corrective phase.
On the downside, the bulls are expected to fiercely defend the $25,000 support because a break below it may accelerate selling. The pair could first drop to the support line of the channel but if this level fails to hold, the pair may plunge to the psychologically important level of $20,000.
ETH/USD Market Analysis
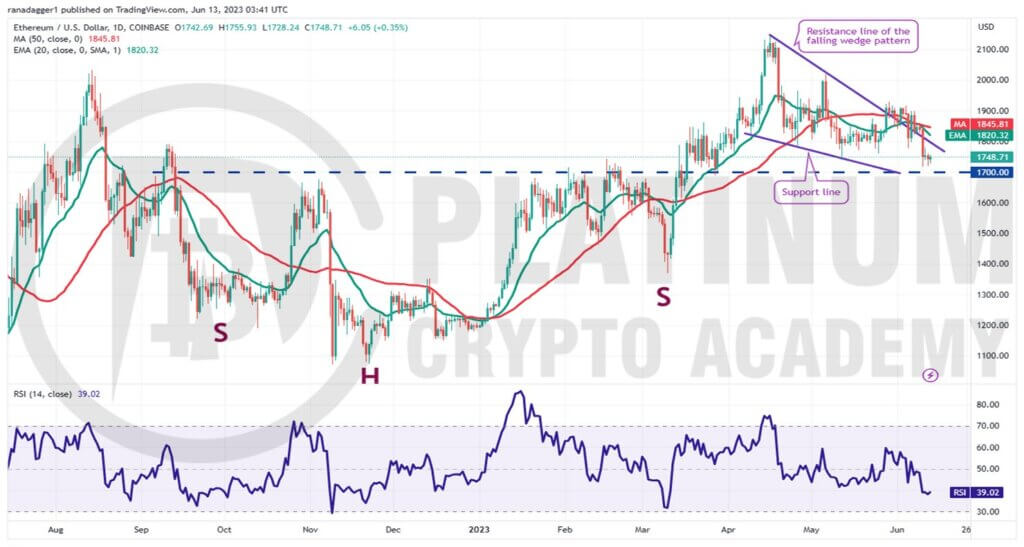
Buyers pushed Ether above the falling wedge pattern on May 28 but they could not build upon the breakout. This shows that demand dries up at higher levels.
After staying above the wedge for several days, the bears pulled the price back into the wedge on June 10. The 20-day EMA has started to turn down and the relative strength index (RSI) is in the negative territory, indicating that the bears have the upper hand.
The important level to watch on the downside is $1,700. If this level cracks, the selling may intensify and the ETH/USD pair could sink to $1,370. This level is again likely to act as a strong support.
Alternatively, if the price bounces off the current level and breaks above the moving averages, it will suggest that the selling pressure is reducing. The pair may then rise to $1,928.
A break and close above this level will indicate the start of a sustained recovery. The pair may then rally to $2,000 and later to $2,143.
BNB/USD Market Analysis
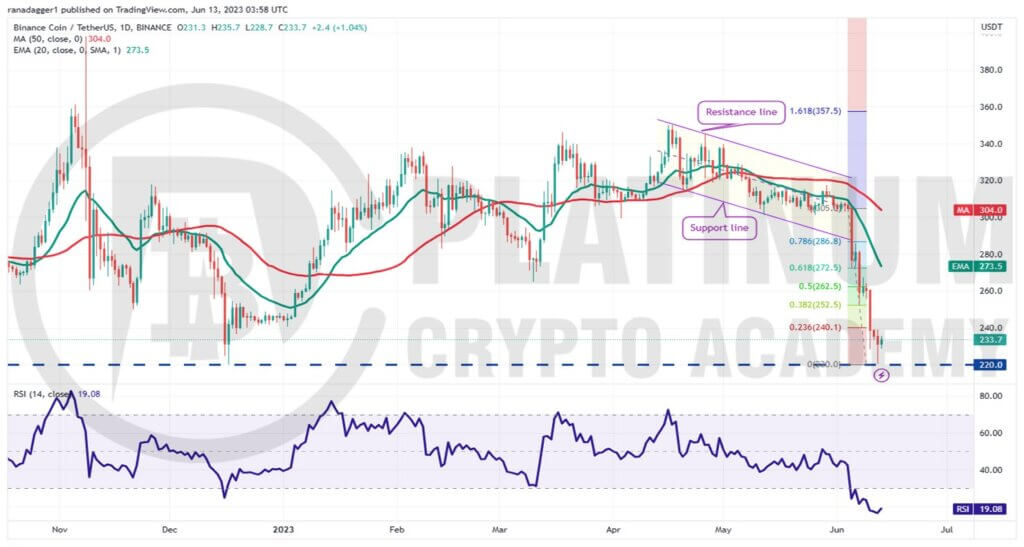
After staying inside the descending channel pattern for several days, Binance Coin plummeted below the channel on June 5. That started a downward spiral which yanked the price down to the vital support at $220.
The vertical fall has sent the RSI deep into the oversold zone, indicating that the selling may have been overdone in the near term. The BNB/USD pair may start a bounce, which could reach the 38.2% Fibonacci retracement level of $252.
If the price turns down from this level, it will suggest that the bears continue to sell on minor rallies. That will increase the likelihood of a break below $220. The next support on the downside is $200.
Alternatively, if buyers drive the price above $252, the pair could reach the 20-day EMA. This level is likely to act as a major hurdle but if bulls overcome it, the pair may soar to the 50-day simple moving average (SMA).
XRP/USD Market Analysis
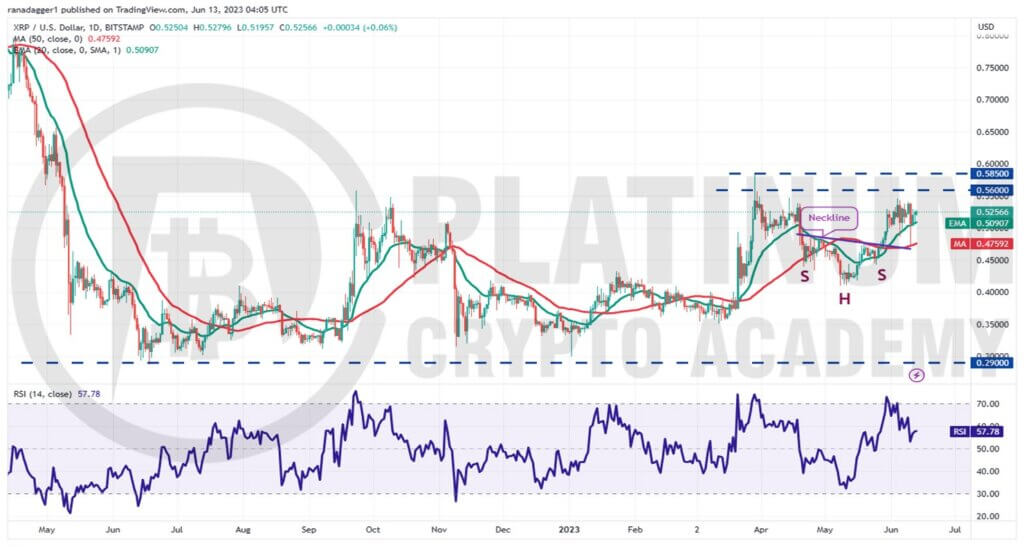
XRP is one of the few major cryptocurrencies that is still trading above its 20-day EMA. The bears tried to start a correction on June 10 but the bulls aggressively purchased the drop to the 50-day SMA.
The bulls will have to overcome the $0.56 to $0.59 resistance zone to start the next leg of the up-move. The XRP/USD pair could then surge to $0.65 and later to $0.80.
Another possibility is that the price turns down from the overhead zone. In that case, the pair may consolidate between the 20-day EMA and $0.59 for a few days.
The first sign of weakness will be a break and close below the 20-day EMA. Such a move will suggest that the short-term bulls have given up and are booking profits.
That will increase the possibility of a drop to the 50-day SMA. A break below this level could clear the path for a potential fall to $0.41.
ADA/USD Market Analysis
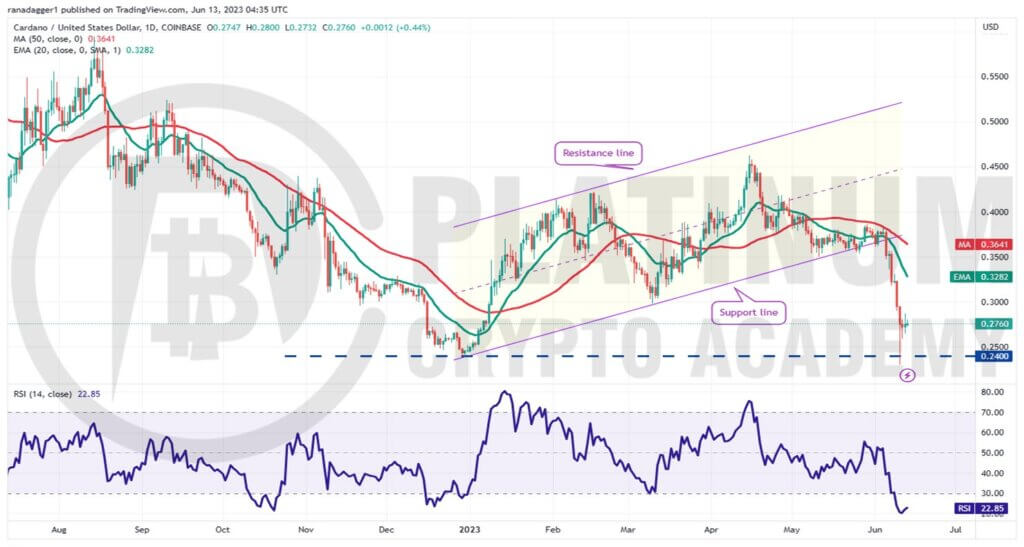
Cardano broke below the ascending channel pattern on June 5, invalidating the bullish setup. That started a downward spiral which tugged the price below the strong support near $0.24 on June 10.
The aggressive selling of the past few days has sent the RSI into deeply oversold territory, indicating that a recovery may be around the corner.
The long tail on the June 10 candlestick shows that the bulls are defending the level with vigor. The ADA/USD pair could start a relief rally, which could reach the 20-day EMA.
If the price turns down from this level, the bears will again try to sink and sustain the pair below $0.24. If they can pull it off, the pair may plunge toward $0.20.
On the other hand, a break and close above the 20-day EMA will suggest that the bears are losing their grip. The pair may first rise to the 50-day SMA and subsequently to $0.39.
Hopefully, you have enjoyed today’s article for further coverage please check out our crypto Blog Page. Thanks for reading! Have a fantastic day! Live from the Platinum Crypto Trading Floor.
Earnings Disclaimer: The information you’ll find in this article is for educational purpose only. We make no promise or guarantee of income or earnings. You have to do some work, use your best judgement and perform due diligence before using the information in this article. Your success is still up to you. Nothing in this article is intended to be professional, legal, financial and/or accounting advice. Always seek competent advice from professionals in these matters. If you break the city or other local laws, we will not be held liable for any damages you incur.
