Hi Crypto Network,
For the past two years, November has been the worst month for Bitcoin price. In 2018, Bitcoin plunged 36.93%, whereas, this year, the decline was 17.51%. However, the picture brightens at the performance of the leading cryptocurrency in the last month of the year. Since 2015, December has seen a minimum movement of 30%, which offers a great opportunity for short-term traders.
Historically, halving has proven to be bullish for Bitcoin prices. With the next halving due in May 2020, many traders are positive about the prospects of a rally in Bitcoin. However, a few influential voices in the crypto industry believe that halving will be a non-event this time. Jason Williams, co-founder at digital asset fund Morgan Creek Digital, believes that Bitcoin’s price will remain unaffected during the next halving. Bitmain’s CEO Jihan Wu also has a similar opinion as Williams.
While the volatility in Bitcoin is keeping the short-term traders on the hook, the long-term Hodlers remain unaffected. 64% of the total Bitcoin mined till now has not left respective wallets since 2018. This shows that the whales are confident of much higher prices in the future, hence, they are not participating in the short-term trades.
However, the volatility in Bitcoin offers an opportunity to the retail traders to grow their portfolio. Is this a good time to buy or can crypto prices plunge further? Let’s analyse the charts.
BTC/USD
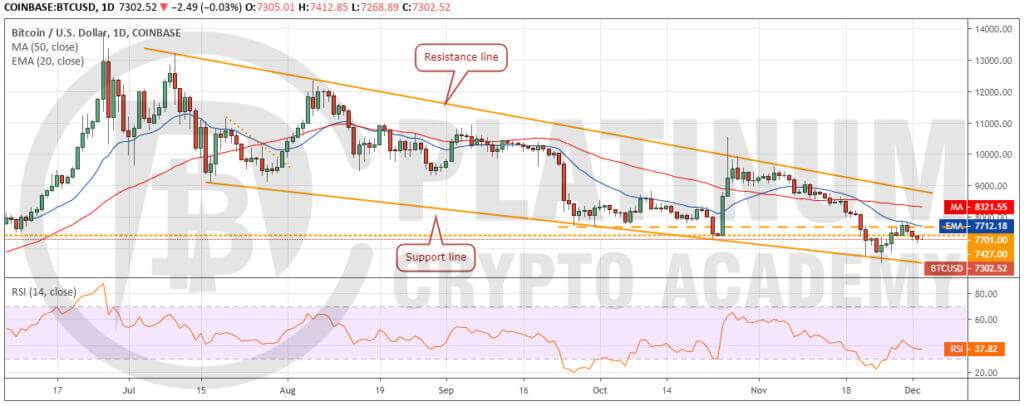
The pullback in Bitcoin, from the lows of $6,526, hit a roadblock at the 20-day EMA. This indicates a lack of demand at higher levels. However, we like that the drop from the 20-day EMA has been gradual. This is a positive sign as it shows that the selling pressure has reduced.
If the cryptocurrency can bounce off the current levels or from the support line, it will indicate accumulation on dips. The first sign of strength will be a break above the recent highs of $7,870.10. Above this level, a move to the resistance line is likely. We anticipate a new uptrend to start if the price sustains above the resistance line. We might suggest a long position on a breakout of $7,900.
Our bullish view will be invalidated if the bears succeed in plunging the price below the recent low of $6,526. Below this level, the decline can extend to the next support at $5,600.
ETH/USD
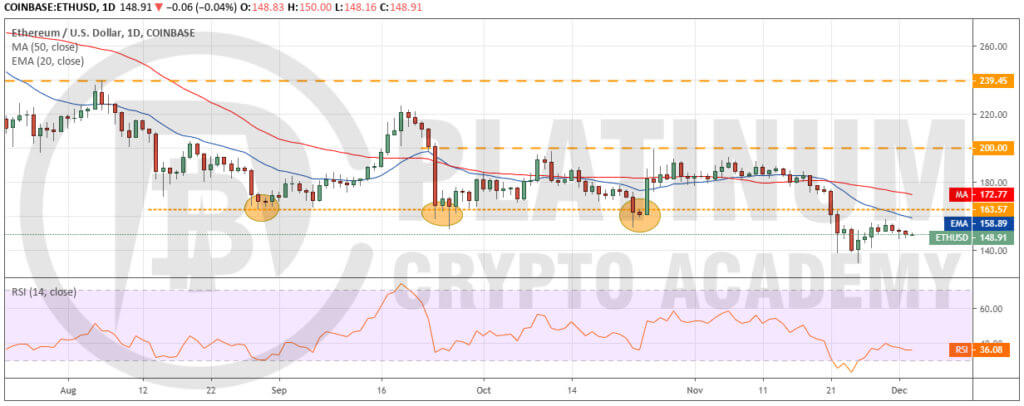
The relief rally in Ether stalled at $157.73. The shallow pullback shows a lack of confidence among the bulls that a bottom is in place. With the 20-day EMA sloping down and the RSI in the negative territory, the advantage is with the bears.
If the bears can drag the price below the recent low of $131.80, the downtrend will resume. The next support on the downside is $120.
However, we anticipate the bulls to aggressively defend the $140-$131.80 support zone. If the bulls can carry the price above the previous support turned resistance of $163.57, it will indicate that the markets have rejected the lower levels. Such a move will increase the possibility of a move to $200. Therefore, we will watch the price action for the next few days and suggest a trade if the price sustains above $163.57.
XRP/USD
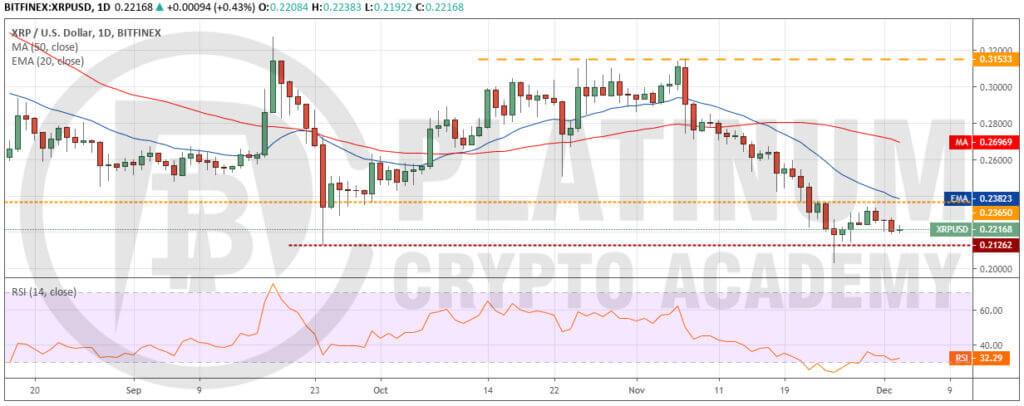
XRP has been trading between $0.21262 and $0.2365 for the past few days. Acceptance of the price below the previous strong support at $0.2365 is a bearish sign. The downsloping 20-day EMA and the RSI close to oversold levels suggests that the bears are in command.
If the digital currency slips below the recent low of $0.20256, the downtrend will resume. A fall to a new yearly low will be a huge negative. The next support on the downside is $0.17.
However, if the current consolidation resolves to the upside, it will indicate demand at lower levels. If the price sustains above $0.2365, a move to the 50-day SMA and above it to $0.31533 is possible. We will suggest long positions after the price sustains above $0.2365.
BCH/USD
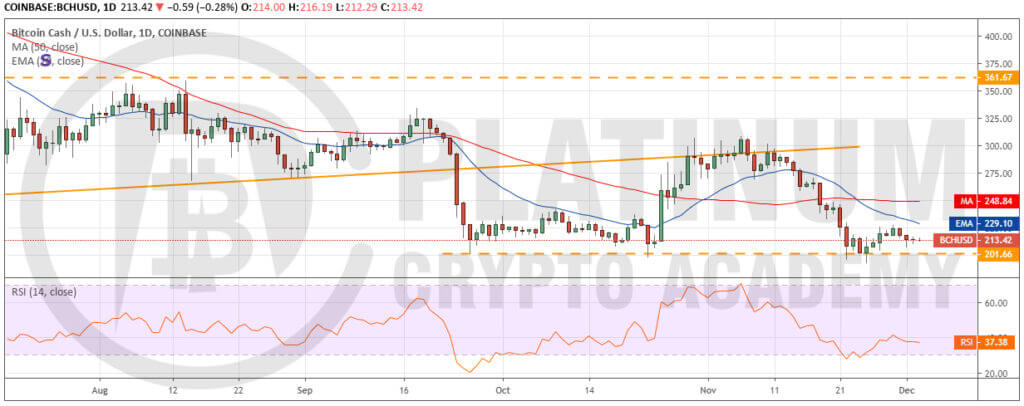
The rebound from the critical support at $201.66 could not break out of the 20-day EMA. This suggests that the traders are closing their long positions on minor rallies. The 20-day EMA is sloping down and the RSI is in the negative territory, which suggests that bears have the upper hand.
The bears will now try to break below $201.66 to $192.10 support zone. If successful, the downtrend will resume. The next target on the downside is $166.98.
However, if the bulls defend the support zone, the price might remain range-bound for a few days. The altcoin will pick up momentum on a break above the moving averages. We will wait for the price to sustain above the 20-day EMA before turning positive.
LTC/USD
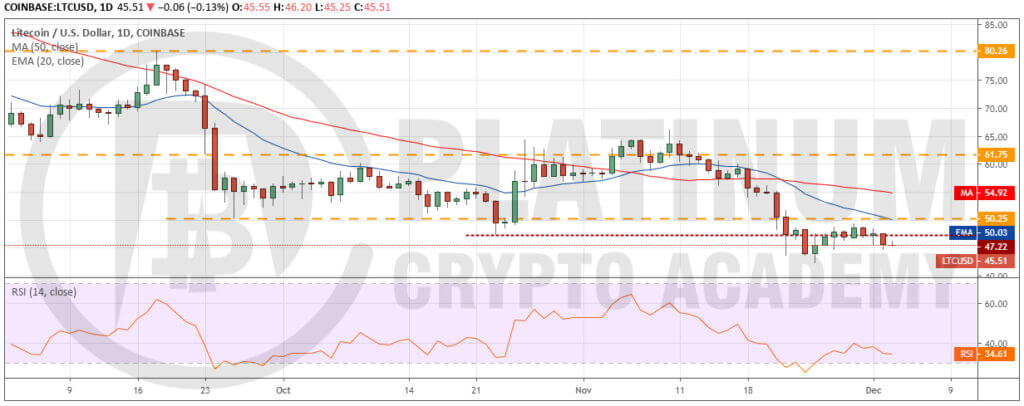
The bulls have not been able to push Litecoin above the $50.25 to $47.22 resistance zone in the past week. This is a negative sign as it shows that the bulls are not buying aggressively even at these levels because they are not confident that a bottom is in place.
The downsloping moving averages and the RSI in the negative zone indicate that bears are in command. The price can retest the recent low of $42.16. If this support cracks, the downtrend will resume. The next support on the downside is way lower at $30.
Conversely, if the altcoin bounces off the current levels or from $42.16 and breaks out of $50.25, it will indicate accumulation at lower levels. We will wait for the price to sustain above $50.25 before turning positive.
Hopefully, you have enjoyed today’s article. Thanks for reading!
Have a fantastic day!
Live from the Platinum Crypto Trading Floor.
Earnings Disclaimer: The information you’ll find in this article is for educational purpose only. We make no promise or guarantee of income or earnings. You have to do some work, use your best judgement and perform due diligence before using the information in this article. Your success is still up to you. Nothing in this article is intended to be professional, legal, financial and/or accounting advice. Always seek competent advice from professionals in these matters. If you break the city or other local laws, we will not be held liable for any damages you incur.
