
Hi Crypto Network,
A Bloomberg report, analyzing data from 13 top exchanges, shows that within a very short span of time, Bitcoin (BTC) futures trading volume has grown to about 50% of spot trading volume. This is the sign of a maturing asset class.
Successful operation of the futures market may provide regulators with the confidence they need as many are concerned that a few entities can easily manipulate the markets at will.
The institutional players who have been staying away due to wild volatility in the crypto sector are also likely to jump in because the futures and options market provides them with a variety of tools that can be used to hedge their positions and reduce their risk.
Along with trading volume, the real usage of cryptocurrency in the economy is also important. A recent analysis by SEMRush found that Bitcoin is the third-most preferred method for online payment in Italy. This ranking places Bitcoin way ahead of traditional credit cards such as American Express, Visa, and Mastercard. This shows that cryptocurrencies are catching up and in some instances racing ahead of the traditional payment methods.
Over the past few days most major cryptocurrencies have given back some of their recent gains, therefore, it is necessary to see if now is a good time to initiate fresh positions or determine whether the pullback will deepen further. Let’s take a look at the charts to see what is happening.
BTC/USD
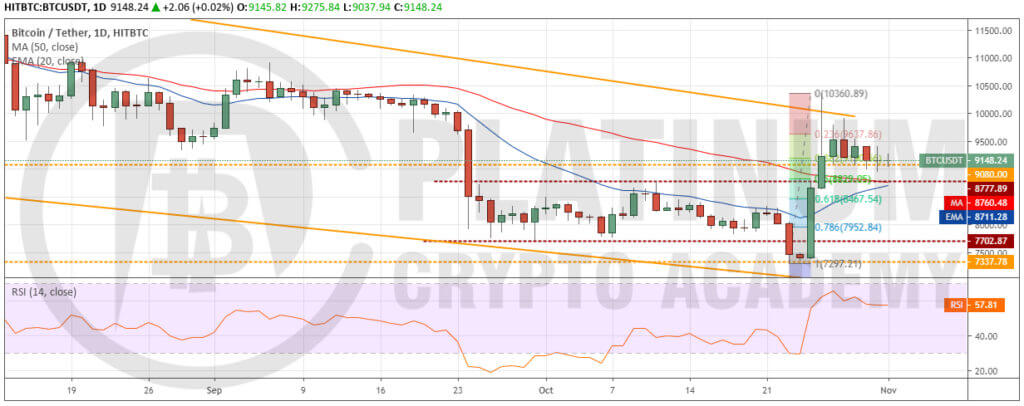
Bitcoin is attempting to find support close to $8,829.05, which is a 50% retracement of the recent rally. This is a bullish sign as it shows that buyers are keen to enter when the price approaches a strong support.
The moving averages are on the verge of a bullish crossover and are placed just below the previous resistance turned support of $8,777.89. If the leading cryptocurrency bounces off this support, a retest of the recent highs of $10,360.89 will be on the cards.
A breakout of this level will resume the upside move that can reach $13,973.50. Therefore, traders can watch the price action at the moving averages and initiate long positions on a strong rebound off it. This trade could play out instantly, hence, a stop loss can be kept just below $8,467.54, which is 61.8% Fibonacci retracement of the recent rally.
Contrary to our assumption, if the BTC/USD pair fails to find support at the moving averages, it will delay the resumption of the up move. It might also result in liquidation of long positions by aggressive bulls, which can drag the price to $8,467.54. If this support also gives way, a retest of the $7,702.87 to $7,297.21 support zone is possible.
ETH/USD
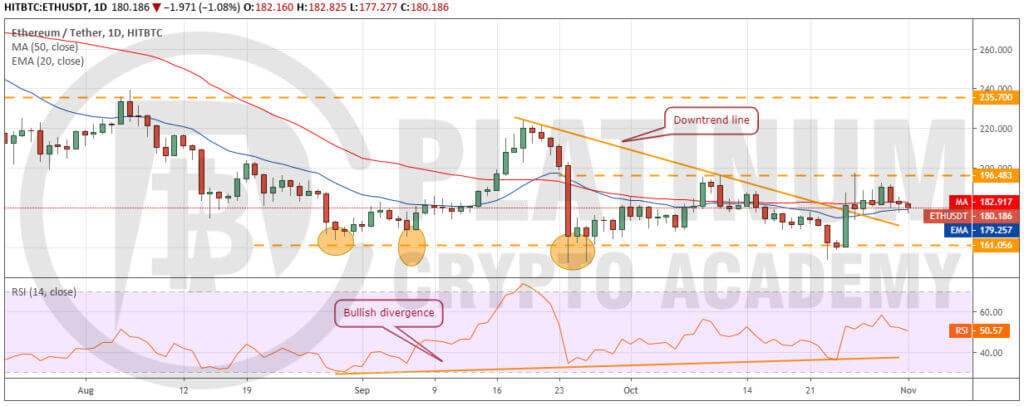
Ether (ETH) has held the moving averages for the past few days but has failed to bounce off it. This increases the possibility of a break below the 20-day EMA. The next support on the downside is at $161.056.
If the bulls defend $161.056-$151.829 support zone, the ETH/USD pair might consolidate for a few more days. The flattening moving averages and the RSI close to the center also points to a range-bound action.
Our neutral view will be invalidated if the pair bounces off the moving averages and climbs above $196.483. Above this level, a rally to $235.70 will be on the cards. For now, the traders can retain the stop loss on the long positions at $150.
XRP/USD
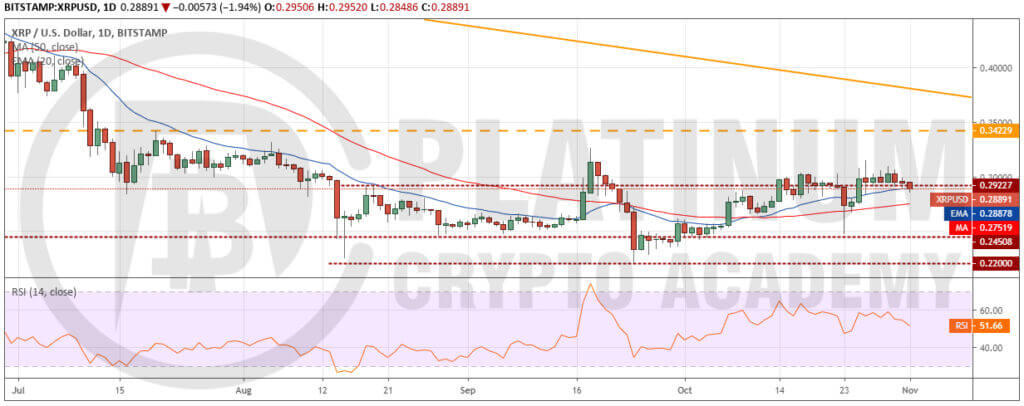
XRP has dipped to the 20-day EMA, which is a strong support. If the price rebounds off this, the bulls will attempt to carry it to $0.34229. Traders can book partial profits close to this level and trail the stops on the rest of the position.
Conversely, if the bears sink the price below the 20-day EMA, the XRP/USD pair can dip to the 50-day SMA. Below this level, the price can drop to the critical support at $0.24508. If this support holds, the pair might remain range-bound for a few days. Traders can hold their long position with the stop loss at $0.24.
BCH/USD
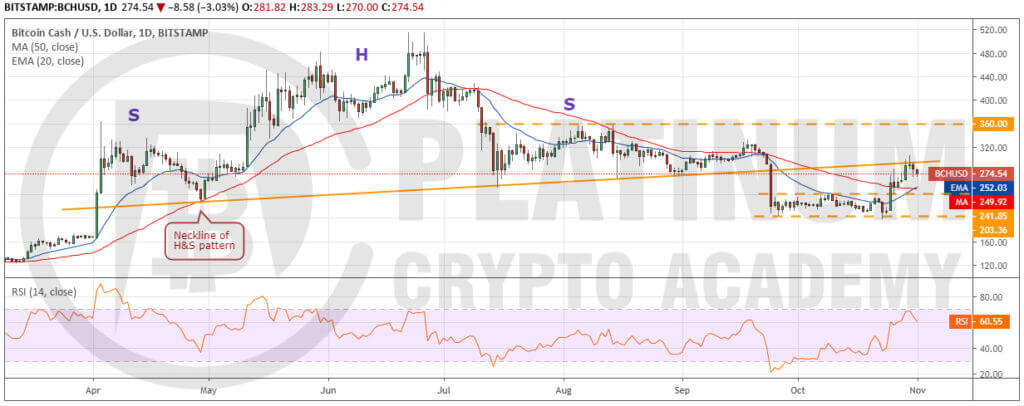
The failure to breakout of the neckline has resulted in a pullback in Bitcoin Cash (BCH). The altcoin can now dip to the moving averages, which is likely to act as a strong support. If the altcoin bounces off the 20-day EMA, the bulls will again attempt to scale the neckline. If successful, a rally to $360 is likely. The bullish crossover of the moving averages and the RSI in positive territory also indicates that the buyers are in command.
Our positive view will be invalidated if the BCH/USD pair fails to rebound off the moving averages. Below this level, it can dip to $241.85. If this level also cracks, the pair will turn negative and can dip to $203.36. Therefore, traders can retain a stop loss on long positions at $235.
LTC/USD
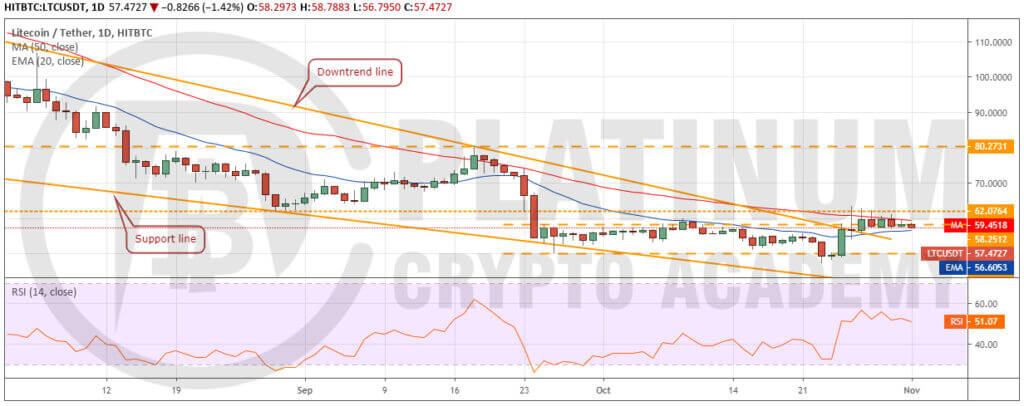
Litecoin (LTC) has been trading between both the moving averages for the past few days. This shows a balance between both the bulls and the bears. The balance will tilt in favor of the bulls if the price breaks out of $63.3876. Above this level, a rally to $80.2731 is likely.
On the other hand, a break below the 20-day EMA will strengthen the bears. Below this level a retest of $50-$47.1851 zone is likely. The flattening moving averages and the RSI close to the midpoint suggests a consolidation for a few days. A breakdown below $47.1851 will resume the downtrend. Traders can protect their long positions with a stop loss of $47.
Hopefully, you have enjoyed today’s article. Thanks for reading!
Have a fantastic day!
Live from the Platinum Crypto Trading Floor.
Earnings Disclaimer: The information you’ll find in this article is for educational purpose only. We make no promise or guarantee of income or earnings. You have to do some work, use your best judgement and perform due diligence before using the information in this article. Your success is still up to you. Nothing in this article is intended to be professional, legal, financial and/or accounting advice. Always seek competent advice from professionals in these matters. If you break the city or other local laws, we will not be held liable for any damages you incur.
