HI CRYPTO NETWORK,
Bitcoin was on a roller-coaster ride in the past week. It plunged on Oct. 23 that turned the sentiment negative. The stiff opposition faced by Facebook’s Libra project had the traders worried as many speculated that regulatory hurdles would delay the adoption of cryptocurrencies into the mainstream.
Another announcement that was perceived as negative was Google’s quantum computing breakthrough.
However, just days later, the sentiment turned around after the Chinese President Xi Jinping said that the country should “seize the opportunity” presented by blockchain technology. This resulted in a sharp turnaround that saw the market capitalization of the crypto space rally from about $203 billion on Oct. 23 to about $262 billion on Oct. 26.
In this see-saw battle between the bears and the bulls, an important development that needs attention is the surge in Bakkt Bitcoin futures trading volume. Bakkt’s volume has been consistently rising, which shows that the institutional traders are again entering the markets. If the volume remains high and the price does not collapse, it will signal accumulation by the stronger hands. This is a huge positive and it indicates that buyers are willing to enter the space if the price starts a trending move.
So, have the major cryptocurrencies bottomed out and are they showing any buy setups? Let’s analyse the charts.
BTC/USD
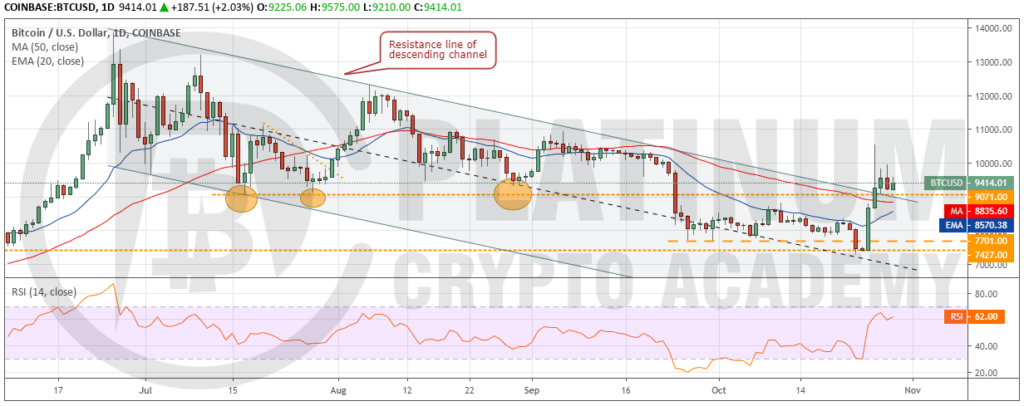
The volatility in Bitcoin picked up last week. On Oct. 23, the bears plunged the price below the $7,701-$7,427 support zone. However, due to a lack of follow-up selling and aggressive buying by the bulls, the cryptocurrency reversed direction sharply on Oct. 25.
This move caught a lot of aggressive bears on the wrong foot as they hurried to cover their short positions. Due to the short squeeze, the cryptocurrency rallied from a low of $7,389.91 on Oct 25 to a high of $10,540.49. That is a move of about 42.6% within two days. The close on Oct. 25 was above the channel, which triggered our buy recommended in an earlier analysis.
After a sharp move, we anticipate a few days of consolidation, post which the uptrend should resume. The next target on the upside is a move to $12,000. Our bullish view will be invalidated if the bears sink the price back into the descending channel. For now, the traders can keep the stop loss at $7,295. We will suggest trailing the stops higher to $8,300 if the bulls push the price above $10,600.
ETH/USD
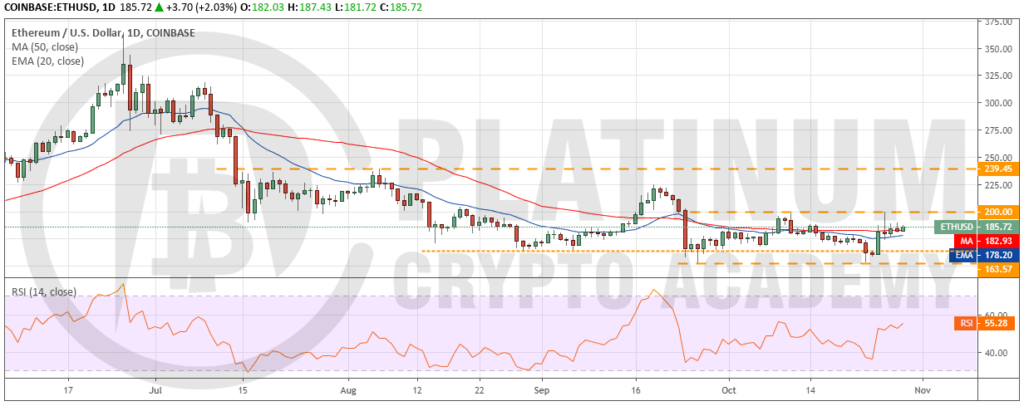
Ether dipped to a low of $153 on Oct. 23, which triggered our stop loss at $163. However, it turned out to be a bear trap because the price quickly recovered and climbed above $163.57 on Oct. 25. Both moving averages are flat and the RSI just above the midpoint, which suggests a balance between the bulls and bears.
The balance will tilt in favour of the bulls if the cryptocurrency breaks out of $200. Above this level, a move to $239.45 will be on the cards. Conversely, if the bulls fail to push the price above $200, a range-bound action is likely. The trend will turn negative on a break below $152.11. We will wait for a reliable buy setup to form before proposing a trade in it.
XRP/USD
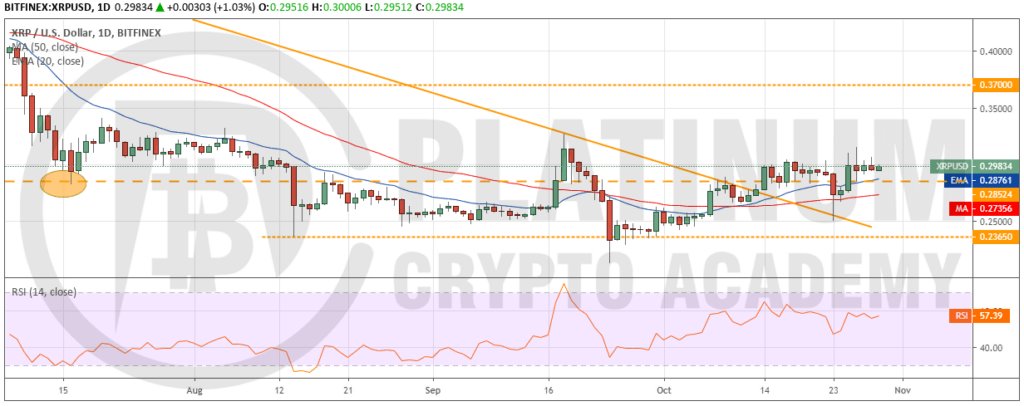
XRP plunged on Oct. 23 but the bears could not sustain the lower levels. This shows that the bulls are keen to buy on dips. The altcoin turned around and rallied above $0.28524 on Oct. 25. Since then, the price has sustained above $0.28524, which is a positive sign. Both moving averages are sloping up gradually and the RSI is in the positive territory. This suggests that bulls have a slight edge.
If the bulls can carry the price above $0.31533, a rally to $0.37 is likely. Therefore, traders can continue to hold the long position with a stop loss of $0.23. The stop loss can be trailed to $0.26 if the price sustains above $0.31533. Our bullish view will be invalidated if the bears sink the price below both moving averages.
BCH/USD
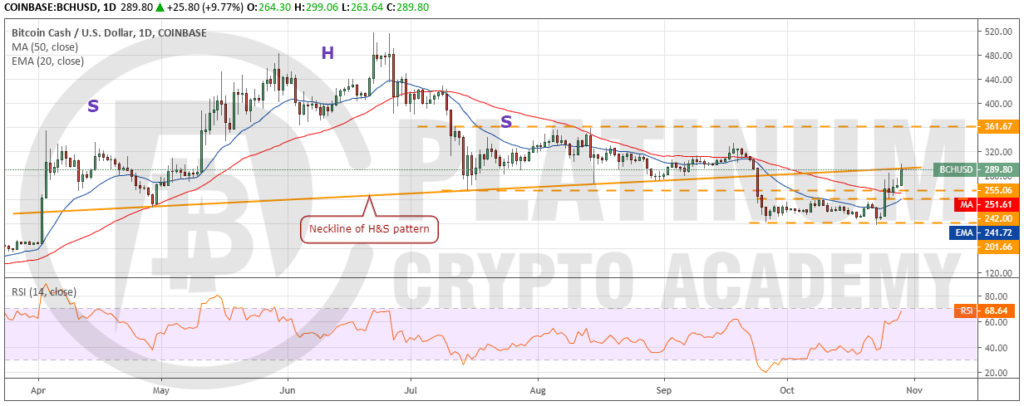
Bitcoin Cash broke out of the overhead resistance at $242 on Oct. 25, which triggered our buy recommendation given in the previous analysis. The pullback met with a stiff resistance at the neckline of the head and shoulders pattern, as we had anticipated. However, the bulls held the pullback above the support of $242 on Oct. 26, which was another buying opportunity, as highlighted by us in the previous analysis
Currently, the altcoin has resumed its up move and is likely to breakout of the neckline. If the price sustains above the neckline, a rally to $361.67 is likely. The traders can book partial profits close to $360 and trail the stops higher on the remaining position. Our bullish view will be negated if the price turns down from the neckline once again and breaks below the moving averages.
LTC/USD
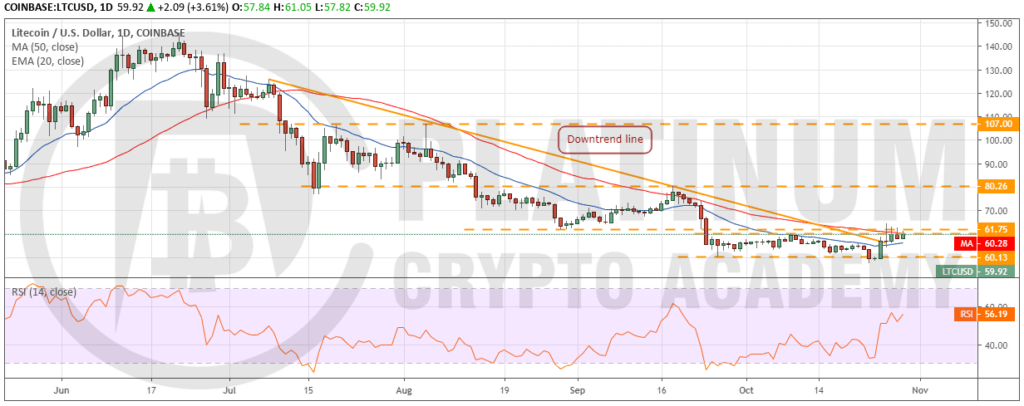
Litecoin reversed direction on Oct. 25 and broke above the downtrend line. It followed up with another up move on Oct. 26 but could not close (UTC time) above the 50-day SMA. Hence, our buy suggested in an earlier analysis did not trigger.
Currently, the bulls are again attempting to scale above the 50-day SMA. If the price closes (UTC time) above the 50-day SMA, a rally to $80.26 is likely. The traders can buy on a close (UTC time) above the 50-day SMA and keep a stop loss of $47. Our view will be invalidated if the altcoin turns down from the current level and breaks below $47.
Hopefully, you have enjoyed today’s article. Thanks for reading!
Have a fantastic day!
Live from the Platinum Crypto Trading Floor.
Earnings Disclaimer: The information you’ll find in this article is for educational purpose only. We make no promise or guarantee of income or earnings. You have to do some work, use your best judgement and perform due diligence before using the information in this article. Your success is still up to you. Nothing in this article is intended to be professional, legal, financial and/or accounting advice. Always seek competent advice from professionals in these matters. If you break the city or other local laws, we will not be held liable for any damages you incur.
