Hi Crypto Network,
Large investors, holding between 1,000 to 1 million Bitcoins, have been buying since the crypto bubble burst in end-2017. They currently hold 42.1% of all Bitcoin supply compared to 37.9% during the peak of the previous bull market.
This shows that these investors are bullish on the long-term prospects of Bitcoin, hence, they have been accumulating at lower levels. On the other hand, the top 1,000 addresses now control 34.8% supply, a marginal increase from 34.4% at the end of 2017.
Though the institutional interest in cryptocurrencies has been gradually increasing, it is still only a slow trickle. Tom Jessop, the president of Fidelity Digital Assets, believes that the lack of regulatory clarity and absence of track record are the main reasons that are holding back the institutional investors. However, he believes that these problems will “solve themselves with time.”
While Bitcoin is staring at a deeper fall in the short-term, Mark Yusko, the chief executive and chief investment officer at Morgan Creek Capital Management, expects Bitcoin to rally to $100,000 by 2021. That is not all, he expects Bitcoin’s bull run to continue and reach $250,000 by 2025 and $400,000 or $500,000 by 2030.
While the long-term targets look attractive, the short-term is painting a bearish picture. Buying in a downtrend can quickly turn the position into a loss. Hence, the traders should wait for the decline to end before buying. Let’s see the critical levels that will signal a possible change in trend.
BTC/USD
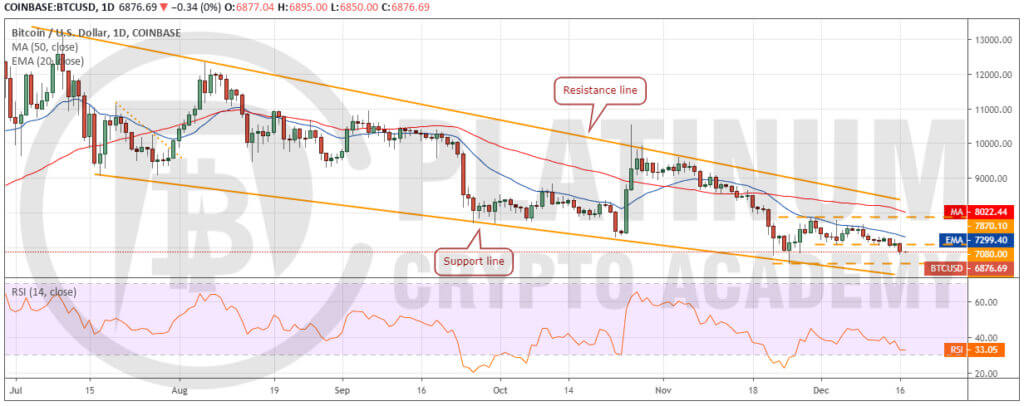
Bitcoin turned down from the 20-day EMA on Dec. 9. This is a negative sign as it shows that the sentiment is to sell on minor rallies rather than buy the dips. The failure of the bulls to defend the support at $7,080 has attracted further selling.
With both moving averages sloping down and the RSI close to the oversold zone, the advantage is clearly with the bears. The next support on the downside is $6,526. If this level also cracks, the sentiment will become hugely negative and will delay the recovery in price.
However, we anticipate the bulls to mount a strong defence at $6,526 level. If the support holds, a relief rally to the 20-day EMA and above it to $7,870 is possible. We shall turn positive after the price breaks out and sustains above the resistance line of the wedge. Until then, traders can remain on the sidelines.
ETH/USD
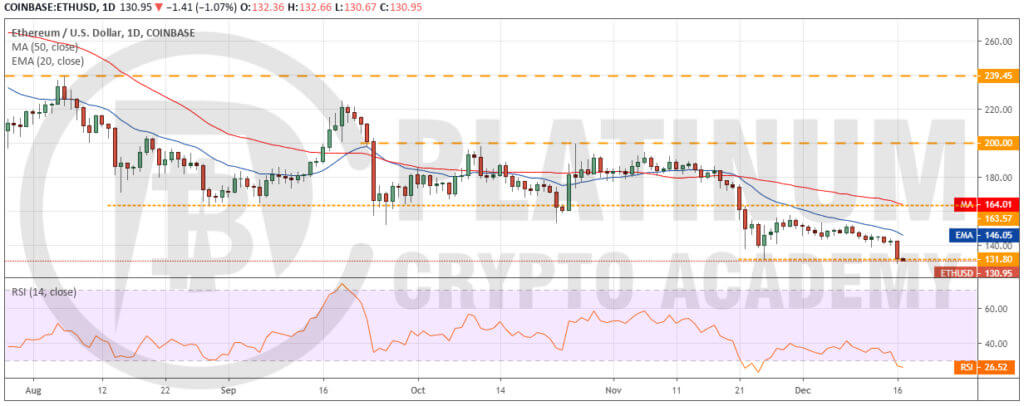
Ether has dipped below the recent low of $131.80, which is a bearish sign. Both moving averages are sloping down and the RSI is in oversold territory, which indicates that bears are in command.
If the price sustains below $131.80, the decline can extend to the next support at $120 and below it $100. However, if the bears fail to sustain the price below $131.80, the bulls will attempt a bounce, which will face stiff resistance at the 20-day EMA. If the price again turns down from the 20-day EMA, the downtrend will resume.
Conversely, a break above the 20-day EMA will indicate accumulation at lower levels. We will wait for a reversal pattern to form before recommending a trade in it.
XRP/USD
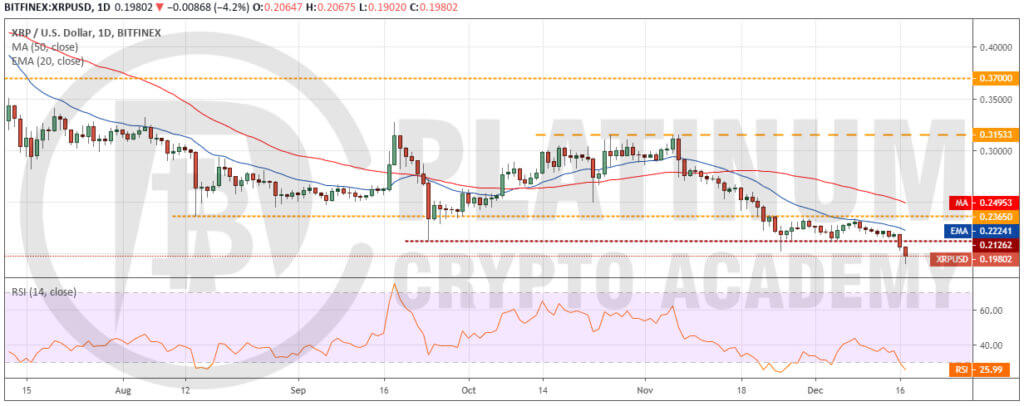
The range between $0.21262 and $0.2365 resolved to the downside on December 16. It was followed by another strong move down, which broke below the recent low of $0.20256. This is a huge negative as it shows that the buyers are still not keen to support XRP at these levels.
Both the moving averages are sloping down and the RSI is in oversold territory, which shows that bears have the upper hand. The next support on the downside is $0.17.
Our bearish view will be invalidated if the bulls quickly push the price back above $0.21262. Such a move will indicate a strong demand at lower levels. However, we suggest traders wait for a trend reversal pattern to form before initiating long positions.
BCH/USD
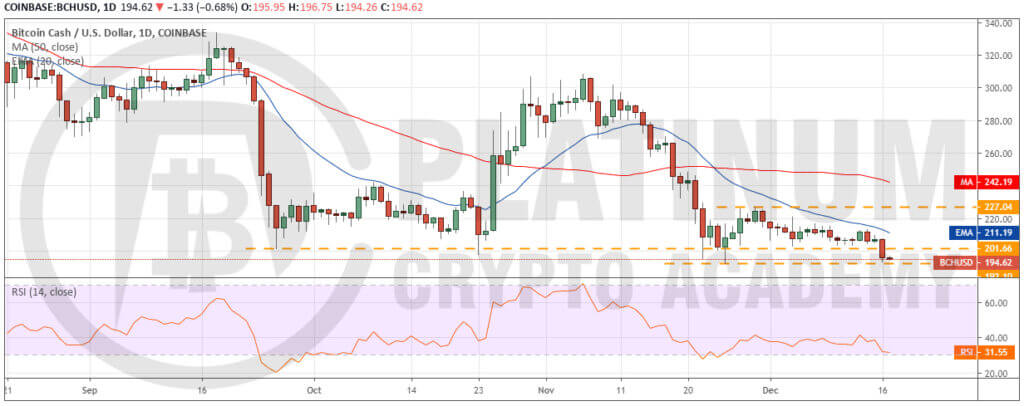
Bitcoin Cash has dropped close to the recent low of $192.10. If the bears sink the price below this support, the downtrend will resume. The next support on the downside is at $166.98. The downsloping moving averages and the RSI close to the oversold zone suggests that bears are in the driver’s seat.
Contrary to our assumption, if the bulls defend the support at $192.10, the cryptocurrency could rebound to the 20-day EMA. A breakout of this level is likely to carry the price to $227.04. We will wait for the price to breakout of this level before turning positive.
LTC/USD
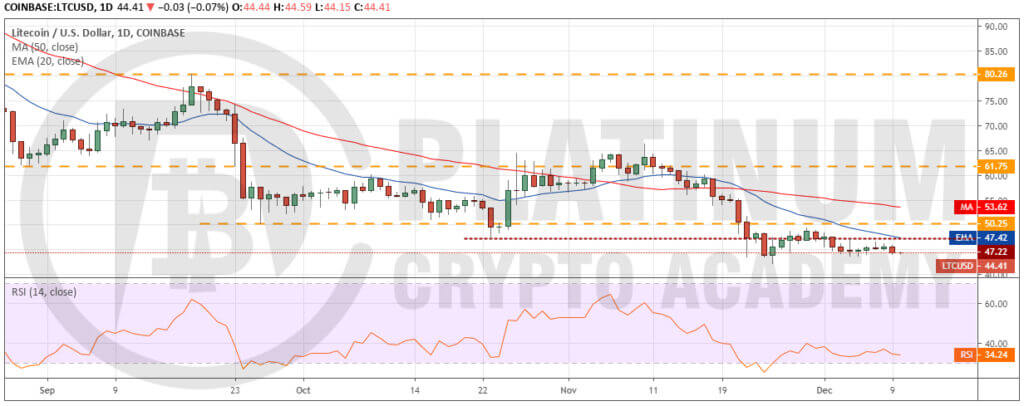
Litecoin dropped below the critical support at $42.16 on December 16. This is a huge negative as it shows a lack of buyers even at these levels. With the fall, the small bullish divergence that was developing on the RSI has been invalidated.
Unless the price quickly climbs back above $42.16, the decline is likely to extend to the next support at $32.
Our bearish view will be negated if aggressive value-buying by the bulls can push the price back above $42.16. However, as the cryptocurrency has been consistently making lower highs and lower lows, we will wait for the trend to change before proposing a trade in it.
Hopefully, you have enjoyed today’s article. Thanks for reading!
Have a fantastic day!
Live from the Platinum Crypto Trading Floor.
Earnings Disclaimer: The information you’ll find in this article is for educational purpose only. We make no promise or guarantee of income or earnings. You have to do some work, use your best judgement and perform due diligence before using the information in this article. Your success is still up to you. Nothing in this article is intended to be professional, legal, financial and/or accounting advice. Always seek competent advice from professionals in these matters. If you break the city or other local laws, we will not be held liable for any damages you incur.
")