
Hi Crypto Network,
Bitcoin has been struggling to stage a sharp recovery. It is trading well below its lifetime highs hit in December 2017. While the short-term and medium-term picture looks uncertain, analysts remain bullish on its long-term prospects.
The latest to announce a sky-high target for Bitcoin is the co-founder of Chinese cryptocurrency exchange BTCC Bobby Lee. He expects Bitcoin to reach $500,000 within the next nine years.
If Bitcoin has to surge to a new high, large-scale participation by institutional traders is needed. Bakkt has said that it has received the green signal from the New York Department of Financial Services to launch its custody service for any institution. Bakkt believes that this move will speed up the “institutional adoption of Bitcoin.”
The payments company Square, in an investor letter, has said that the number of first-time Bitcoin buyers has almost doubled. This shows the growing popularity of cryptocurrencies. Head of Facebook’s cryptocurrency projects David Marcus believes that Bitcoin is digital gold. It is also “decorrelated from the rest of the market,” which makes it an attractive investment bet.
So, should the investors buy the current dip in Bitcoin or can it fall further and drag the crypto markets along with it? Let’s analyse the charts.
BTC/USD
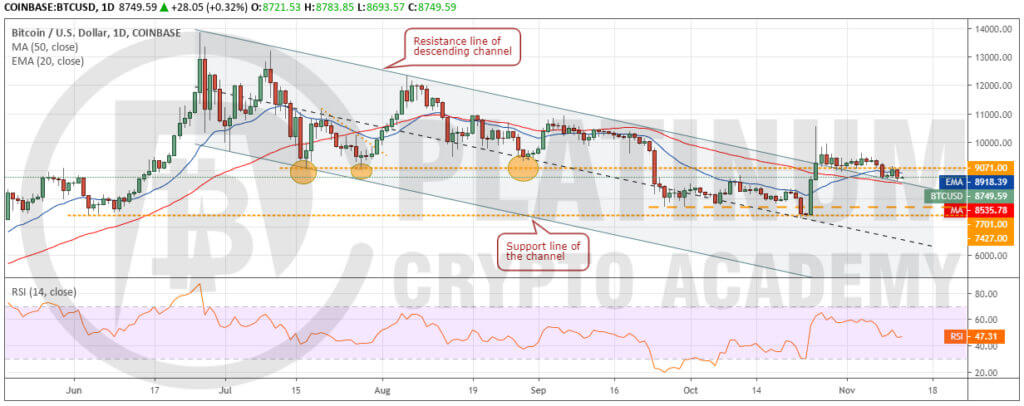
Bitcoin has been gradually losing ground over the past few days, which is a negative sign. It shows that bulls are not keen to buy on dips as they are not confident of the resumption of the rally. As a result, the price has slipped below $9,071 support and the 20-day EMA.
Currently, the bulls are attempting to keep the price above the descending channel. However, unless the price rises and sustains above $9,071, the bears will continue to sell on every minor rally. If the price plummets below the 50-day SMA and re-enters the channel, a drop to $7,701 to $7,427 support zone is possible. The traders can keep the stop loss on the long positions at $7,295.
Conversely, if the cryptocurrency bounces off the current levels and rises above $9,071, a retest of $10,540.49 is likely. Above this level, a rally to $12,000 is possible.
ETH/USD
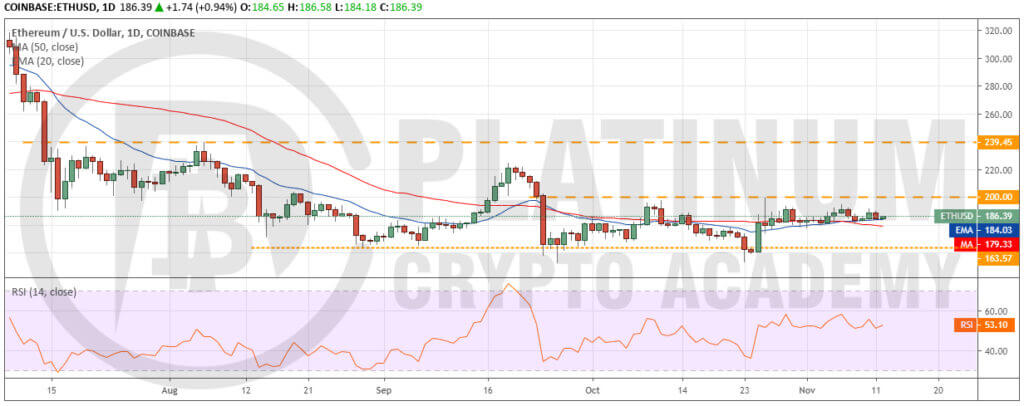
Ether has been consolidating between $163.57 and $200 since September 24. Both moving averages are flat and the RSI is close to the midpoint. This suggests a balance between demand and supply. Longer the consolidation, stronger will be the eventual breakout from it.
If the bulls propel the price above $200, the balance will tilt in favour of the bulls and a rally to $239.45 will be on the cards. Therefore, traders can buy on a breakout and close (UTC time) above $200 and keep a stop loss of $160.
Conversely, if the bears sink the price below the $163.57 to $152.11 support zone, the downtrend will resume. However, we give it a low probability of occurring.
XRP/USD
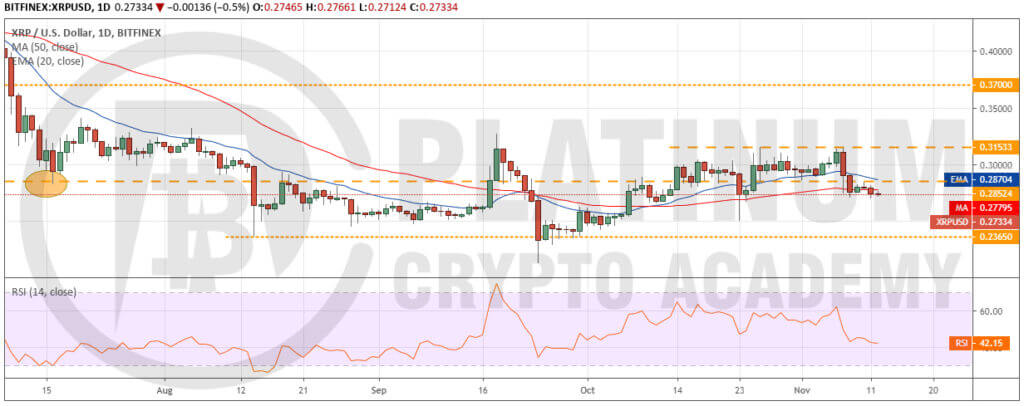
XRP turned down sharply from the overhead resistance of $0.31533 on November 7. The 20-day EMA has turned down and the RSI has dipped into the negative territory. This suggests that the bears have the upper hand. The failure of the bulls to defend the 50-day SMA shows that they anticipate a further fall. The next support on the downside is at $0.23650. If this level also breaks down, a retest of $0.21262 is possible. Therefore, traders can protect long positions with stops at $0.23.
Contrary to our assumption, if the cryptocurrency reverses direction from the current levels and rises above the 20-day EMA, it will indicate accumulation at lower levels. The altcoin will pick up momentum after it crosses the overhead resistance at $0.31533.
BCH/USD
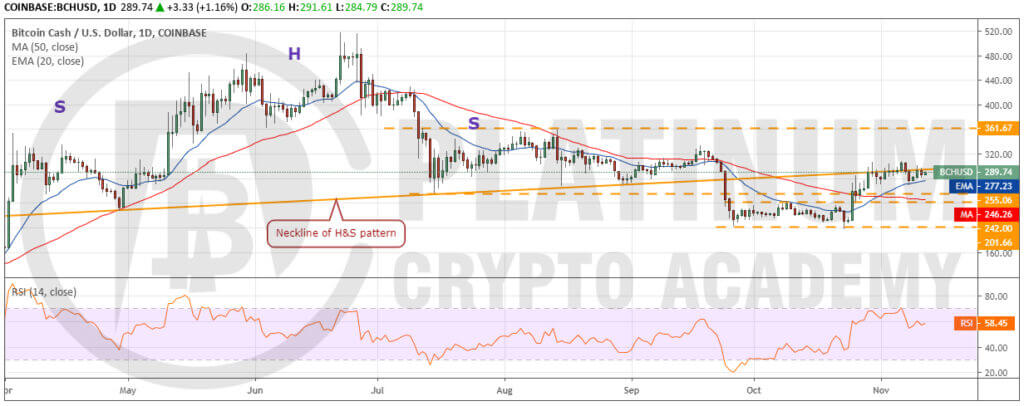
The bears have been aggressively defending the resistance at the neckline of the head and shoulders pattern. However, the positive thing is that the bulls have not allowed the price to dip below the 20-day EMA, which is sloping up gradually. This shows that the buyers hold a slight advantage and are accumulating on dips.
If Bitcoin Cash can bounce off the 20-day EMA and sustain above $308.21, it is likely to pick up momentum. The next target on the upside is $361.67, which is likely to offer a strong resistance. Hence, traders can book profits close to $360 and trail the stops on the remaining position.
Contrary to our assumption, if the bears sink the price below $269.10, a drop to $255.06-$242 support zone is possible. If this zone cracks, a drop to $201.66 is likely. Therefore, traders can trail the stops higher to $240. Let’s reduce the risk.
LTC/USD
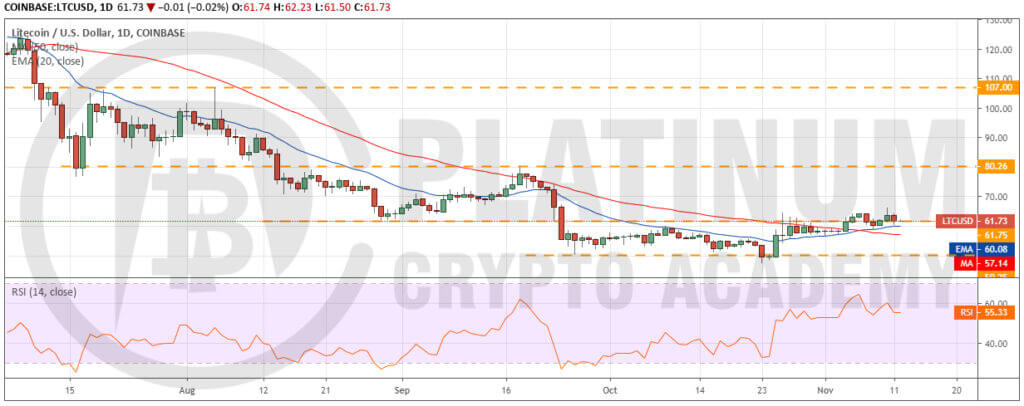
Litecoin scaled and closed (UTC time) above the 50-day SMA on November 4, which triggered our buy proposed in the previous analysis. Though the bulls managed to push the price above the overhead resistance of $61.75, they have not been able to sustain it. This shows selling at higher levels.
However, on the downside, the bulls are defending the 20-day EMA, which is a positive sign. If the price rises above $66.19, the cryptocurrency is likely to pick up momentum. The next target on the upside is $80.26 where traders can book partial profits and trail the stops on the rest of the position. For now, the stops can be kept at $47 but they can be trailed higher after the price breaks out of $66.19.
Our bullish view will be invalidated if the bears sink the price below both moving averages. In such a case, a drop to the critical support at $50.25 is possible.
Hopefully, you have enjoyed today’s article. Thanks for reading!
Have a fantastic day!
Live from the Platinum Crypto Trading Floor.
Earnings Disclaimer: The information you’ll find in this article is for educational purpose only. We make no promise or guarantee of income or earnings. You have to do some work, use your best judgement and perform due diligence before using the information in this article. Your success is still up to you. Nothing in this article is intended to be professional, legal, financial and/or accounting advice. Always seek competent advice from professionals in these matters. If you break the city or other local laws, we will not be held liable for any damages you incur.
")