
Hi Crypto Network,
Bitcoin halving is less than 94 days away. This event is being watched closely by the crypto community as many believe that it will boost Bitcoin prices higher. Weiss Ratings has upgraded the rating for Bitcoin to A-(excellent) because of the “improving fundamentals and the positive price action ahead of Bitcoin’s next halving.”
Cryptocurrencies have seen a strong run in 2020. The total market capitalization of the crypto universe has risen from about $191.5 billion at the start of the year to a high of over $290 billion on February 10. This is a rise of about 51% year-to-date.
In comparison, at its highest level of $10,199 on February 10, Bitcoin had risen only about 42% year-to-date. This shows that Bitcoin has underperformed the crypto rally in 2020. Its market dominance, which was closer to 68.3% at the start of the year has gradually declined to 63.3% at press time. This indicates that the altcoins have made a comeback this year.
However, after Bitcoin hit the psychologically important level of $10,000, Anthony Pompliano, co-founder & partner at Morgan Creek Digital said: “Bitcoin just hit $10,000. I still think that Bitcoin will hit $100,000 by end of December 2021.”
Though we are also bullish on Bitcoin, we do not expect a vertical rally that can mirror the rise seen in 2017. Will the major cryptocurrencies extend their rally in the next week or do we see the possibility of a pullback? Let’s analyse the charts to find out.
BTC/USD
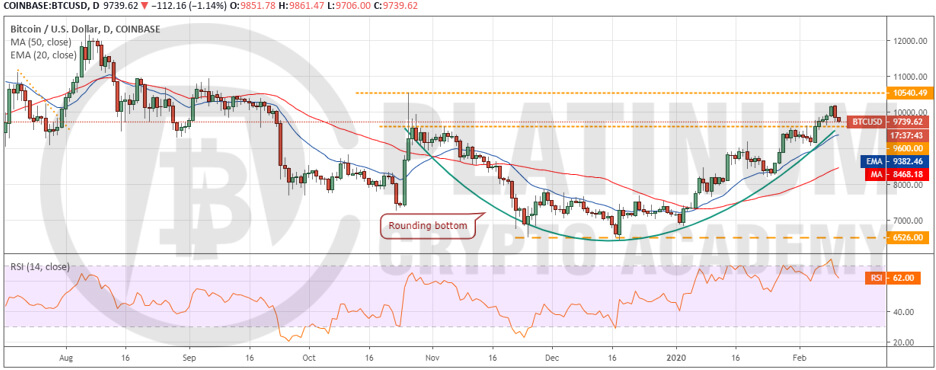
Bitcoin broke above the overhead resistance at $9,600 on February 5, which completed the rounding bottom pattern. This setup has a pattern target of $12,770. The upsloping moving averages and the RSI in the positive territory show that bulls are in command.
However, we anticipate the bears to mount a stiff resistance in the $10,540.49 to $11,000 zone. Currently, the bears are attempting to sink the price back below the breakout level of $9,600.
If successful, a drop to the 20-day EMA is possible. We expect the bulls to defend this support. A strong bounce off the 20-day EMA will increase the possibility of a breakout above the overhead resistance zone.
Our bullish view will be invalidated if the cryptocurrency slips below the 20-day EMA and the next support at $9,078.05. If that happens, a drop to the 50-day SMA is possible.
ETH/USD
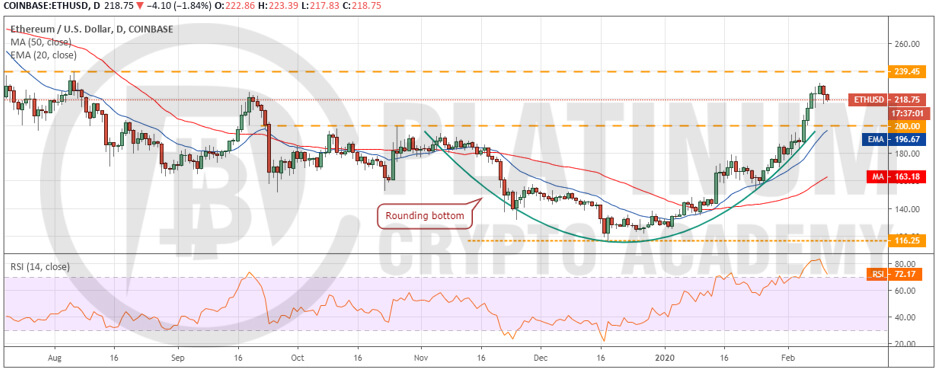
Ether broke above the overhead resistance at $200 on February 5, which completed a rounding bottom pattern. This setup has a target objective of $283.75. The upsloping moving averages and the RSI in the overbought zone show that bulls are in command.
However, after the breakout of a stiff resistance, usually, the price retests the breakout level. In this case, a drop to $200 is possible. If the price bounces off this support, the bulls will again attempt to carry the price above the overhead resistance at $239.45.
If successful, the uptrend will resume. The strong bounce off $200 can offer a low-risk buying opportunity to the traders. Conversely, if the altcoin dips and sustains below the critical support at $200, the decline can extend to the 50-day SMA.
XRP/USD
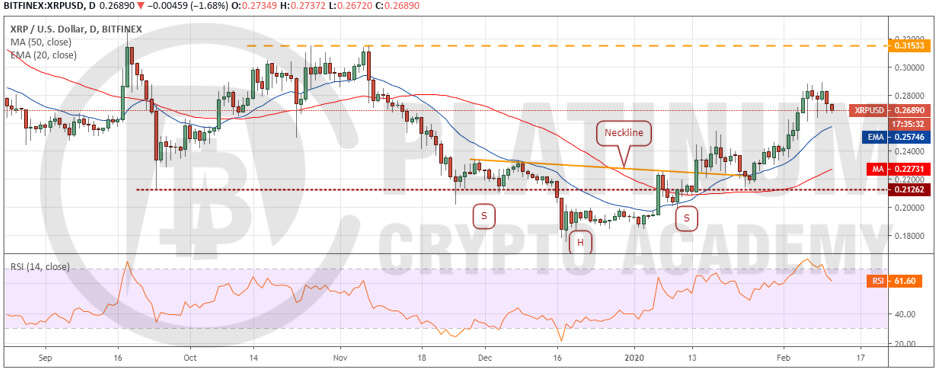
XRP climbed above $0.282 on February 5, which hit the target objective of the inverted head and shoulders pattern. However, the bulls could not sustain the momentum and push the price to the next target of $0.31533. This shows a lack of demand at higher levels.
The price can now dip to the 20-day EMA, which is likely to act as a support. If the price bounces off this level, the bulls will again try to push the price to $0.31533.
Conversely, if the bears sink the price below the 20-day EMA, the drop can extend to the 50-day SMA. The traders can wait for the bounce off the 20-day EMA to sustain before buying. On the other hand, if the 20-day EMA support breaks down, we suggest traders wait on the sidelines.
BCH/USD
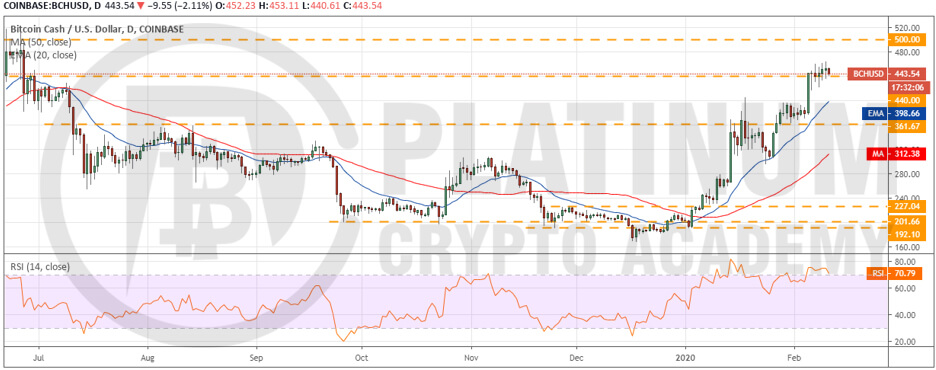
The tight $363 to $396 range in Bitcoin Cash resolved to the upside with a strong breakout on February 5. Though the bulls have been attempting to carry the price above $440, they have not been able to build on the momentum.
This shows that bears are aggressively defending the $440 to $500 zone. Currently, the bears are attempting to sink the price back below $440. If successful, a drop to the 20-day EMA is possible.
A bounce off the 20-day EMA will be a positive sign and will increase the possibility of a move to $500. The upsloping moving averages and the RSI close to the overbought zone shows that bulls have the upper hand.
Our bullish view will be invalidated if the altcoin dips below the 20-day EMA. The trend will turn in favour of the bears on a break below the critical support at $361.67.
BSV/USD
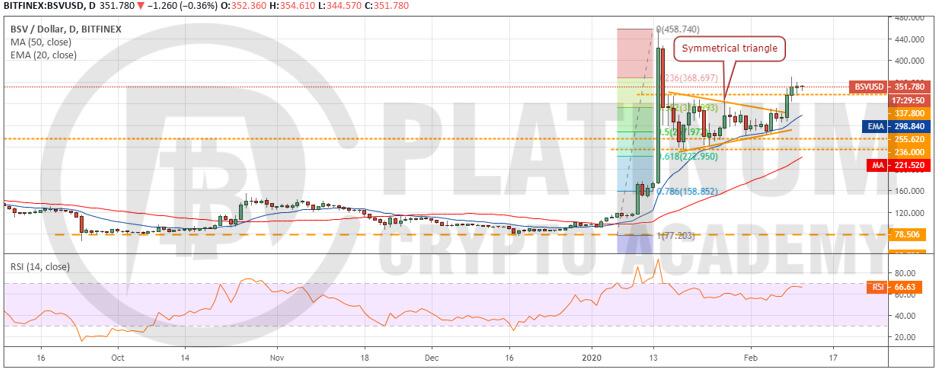
The bulls broke above the symmetrical triangle on February 8 and followed it up with a move above the overhead resistance of $337.80 on February 9. This shows that the bulls are in command.
The breakout from the triangle has a target objective of $439.6, which is just below the lifetime highs at $458.74. A break above $458.74 will be a huge positive.
Contrary to our assumption, if the bears drag the price back below $337.80, it will indicate a lack of buyers at higher levels. The altcoin is likely to find support close to the 20-day EMA. If the price bounces off the 20-day EMA, the bulls will again attempt to push the price towards the lifetime highs.
However, if the support at the 20-day EMA cracks, the drop can extend to the horizontal support at $236.
Hopefully, you have enjoyed today’s article. Thanks for reading!
Have a fantastic day!
Live from the Platinum Crypto Trading Floor.
Earnings Disclaimer: The information you’ll find in this article is for educational purpose only. We make no promise or guarantee of income or earnings. You have to do some work, use your best judgement and perform due diligence before using the information in this article. Your success is still up to you. Nothing in this article is intended to be professional, legal, financial and/or accounting advice. Always seek competent advice from professionals in these matters. If you break the city or other local laws, we will not be held liable for any damages you incur.
