As the positive sentiment continues regular readers will know we provide Cryptocurrency weekly market analysis, week its been a pleasure to provide as all crypto enthusiasts will be enyoing this boyant period.
If Bitcoin does not turn down and plunge from the current levels, several altcoins may start a trending move. Bitcoin has been inching higher towards all-time highs. However, unlike the previous bull market in 2017, the euphoria and frenzy, mostly among retail traders have been absent. This is a positive sign as it shows that the current rally has largely been driven by stronger hands who are not buying cryptocurrencies to get rich overnight.
CRYPTOCURRENCY MARKET & PRICE ANALYSIS – FUNDAMENTAL VIEW
Senior commodity strategist at Bloomberg Intelligence, Mike McGlone, believes that the current rally is likely to continue in 2021, with the major hurdle being the all-time highs at $20,000. After that, McGlone opines that Bitcoin could hit a market capitalisation of $1 trillion.
In another bullish projection, Thomas Fitzpatrick, global head of Citibank’s CitiFXTechnicals market insight product, believes that Bitcoin could rally to $318,000 by 2021.
Veteran trader Peter Brandt said that if previous bull markets are considered, Bitcoin could be in the early stages of the next bull cycle.
The institutional investors may also be holding a similar view as they have continued to pour money into Grayscale Investments. The cryptocurrency fund manager reported that it now holds over 500,000 Bitcoin in its Bitcoin trust, an increase of over 50% in the past six months.
While these bullish projections are a positive sign, investors should not get carried away by them. Traders should keep their greed under control and wait for the right opportunity to invest. Let’s study the charts of the top-5 cryptocurrencies to determine the path of least resistance.
CRYPTOCURRENCY MARKET ANALYSIS WEEKLY UPDATE – HOW TO TRADE BITCOIN
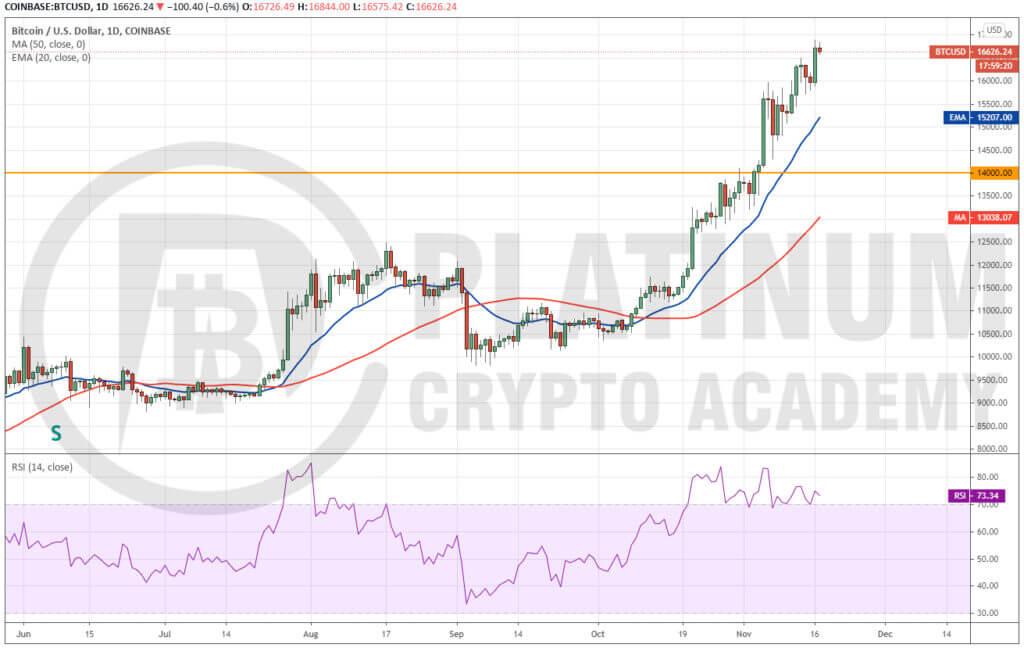
Cryptocurrency market & price analysis saw Bitcoin broke out of the $16,000 resistance on November 12 and reached an intraday high of $16,892 on November 16. The upsloping moving averages and the RSI in the overbought territory suggest that bulls are firmly in the driver’s seat.
However, the BTC/USD pair has now reached close to the stiff overhead resistance at $17,200. This is the final opportunity for the traders to stall this uptrend, else a retest of the all-time highs is possible.
The pair has not even corrected to the 20-day EMA since it started this leg of the up-move in early October. This shows that the rally is overheated in the short-term, hence, a dip from the overhead resistance is expected.
Therefore, traders who are left with 20% of their initial long positions can close the trade at the current levels.
Any dip from the current levels could pull the pair down to the 20-day EMA. The bulls are likely to defend this level but if the rebound lacks strength, a deeper correction to $14,000 could be on the cards.
Such a correction would be bullish for the pair in the long-term because, during future declines, it will act as a floor where bulls may step in and buy. For now, the investors can remain on the side-lines and wait for the next opportunity to buy.
CRYPTOCURRENCY MARKET ANALYSIS WEEKLY UPDATE– HOW TO TRADE ETHEREUM
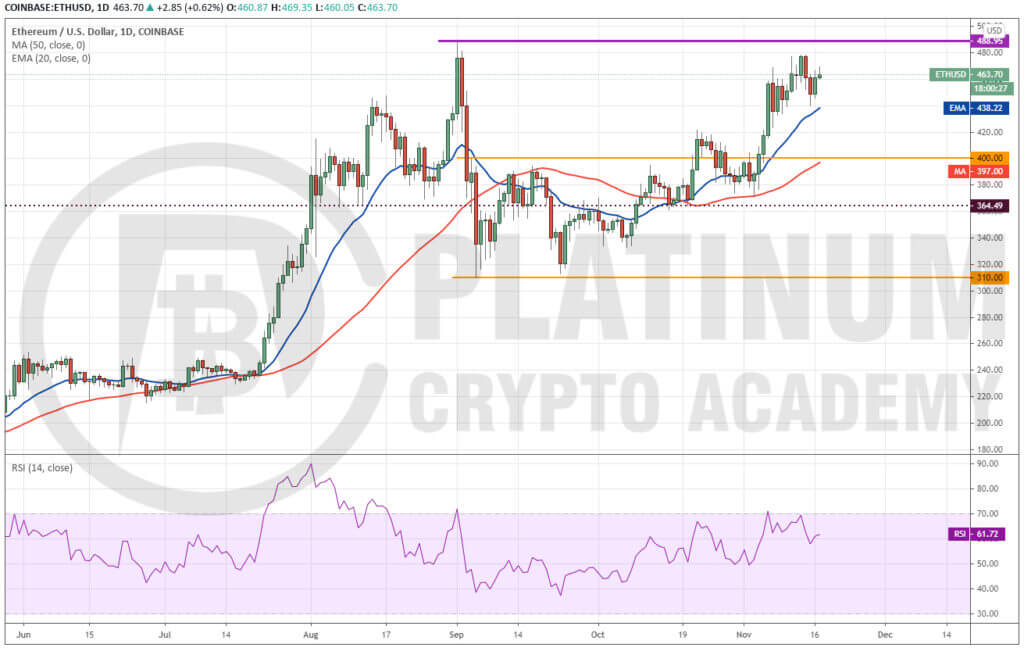
Cryptocurrency market & price analysis saw the Ethereum price had jump close to the $488.95 resistance on November 13 and that gave an opportunity for the traders to book partial profits as suggested in the previous analysis.
The traders can trail the remaining positions below the 20-day EMA. We are not suggesting to book complete profits because the bulls will make one more attempt to push the Ethereum price above $488.95.
If they succeed, the ETH/USD pair could start its journey to $550 and higher. The rising moving averages and the RSI in the positive zone suggest that bulls are in command.
Contrary to this assumption, if the price again turns down from the overhead resistance and breaks below the 20-day EMA, it will open the doors for a deeper correction to $400.
If that happens, traders can avoid bottom fishing until the pair forms a new bullish setup.
XRP MARKET ANALYSIS – HOW TO TRADE XRP
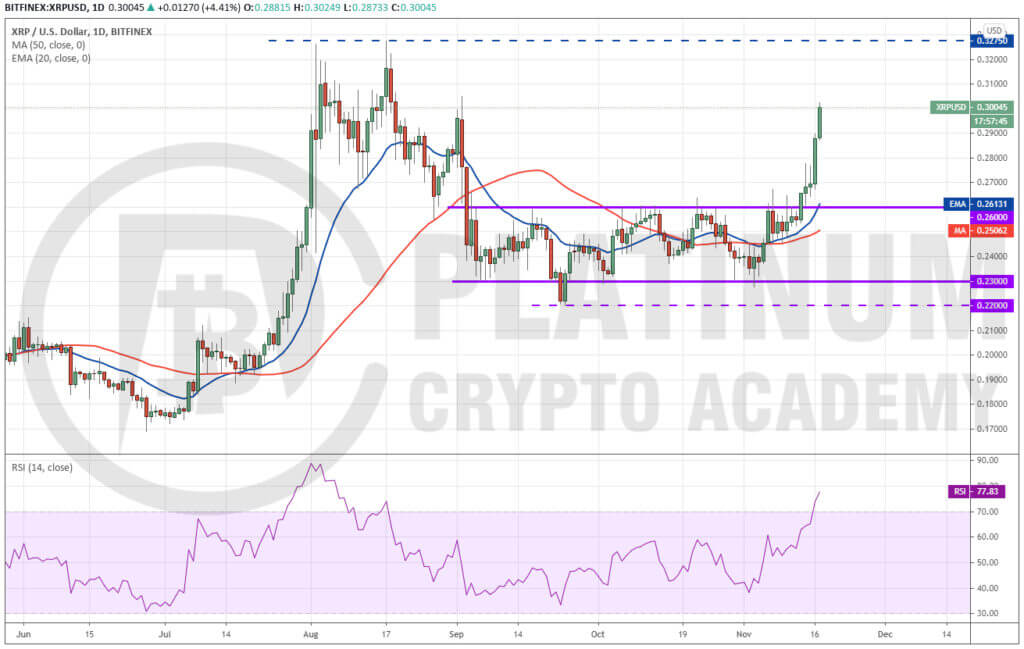
XRP broke above the $0.26 resistance on November 13 and that gave an opportunity to the traders to buy, as suggested in the Cryptocurrency market analysis weekly update last week.
Although the bears tried to pull the XRP/USD chart back into the range on November 14 and 15, the bulls did not allow the price to break below $0.26. This showed that the bulls were waiting to buy the dips.
This attracted further buying on November 16 and the pair has hit the first target objective of $0.30 today.
The moving averages have turned up and the RSI has jumped into the overbought zone, which shows that the bulls are in control. The longer the consolidation, the stronger the rally after the breakout.
Although the bears will try to stall the current up-move at $0.30, the possibility of a rally to $0.3275 is high.
Traders can however book partial profits close to $0.30 and keep the stop-loss on the rest at breakeven. If the momentum picks up, the bulls may even succeed in driving the price above $0.3275. If that happens, the rally could extend to $0.35 and then $0.40.
CRYPTOCURRENCY MARKET ANALYSIS WEEKLY UPDATE – HOW TO TRADE LITECOIN
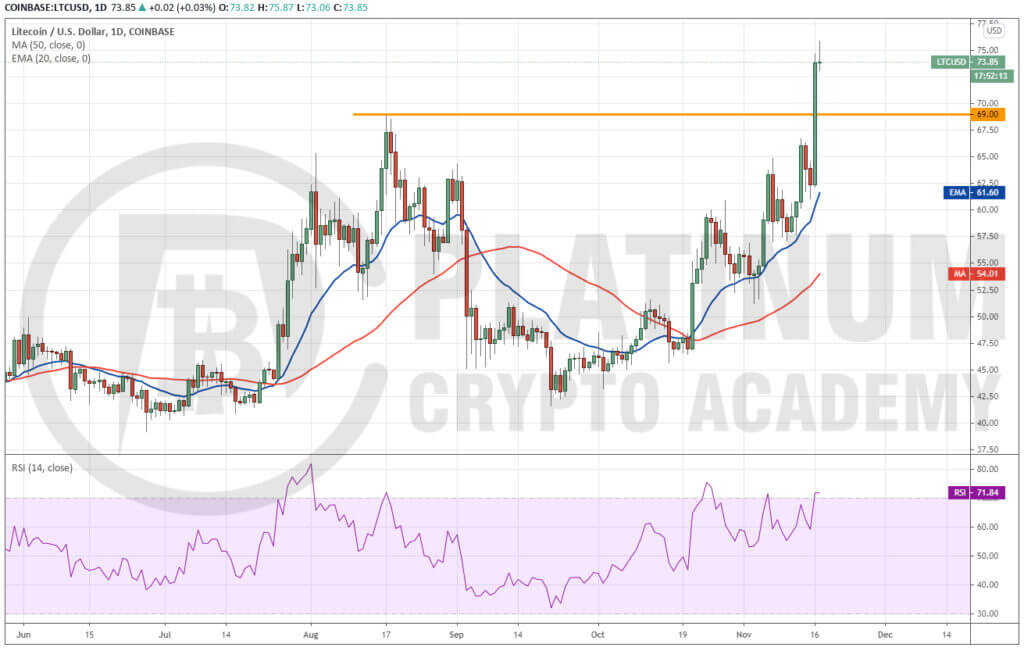
Litecoin has jumped into the top-5 list of cryptocurrencies with a sharp up-move in the last week. It surged 18.37% on November 16 and broke the $69 resistance.
The upsloping moving averages and the RSI in the overbought zone suggest that bulls are in command. The next target objective on the upside is $85 and then $100.
Usually, after the price breaks out from a stiff resistance, it turns down and retests the breakout level. In this case, a drop to $69 is possible. If the price rebounds off this level, the bulls will try to resume the uptrend. Such a move will confirm $69 as the new floor.
On the other hand, if the bears sink and sustain the price below $69, it will suggest weakness as it could trap several aggressive bulls who may be forced to close their positions.
We do not find any trading opportunity at the current levels because we do not believe in chasing prices higher. We will wait for a new low-risk trade setup to form before proposing a trade in it.
CHAINLINK MARKET ANALYSIS – HOW TO TRADE CHAINLINK
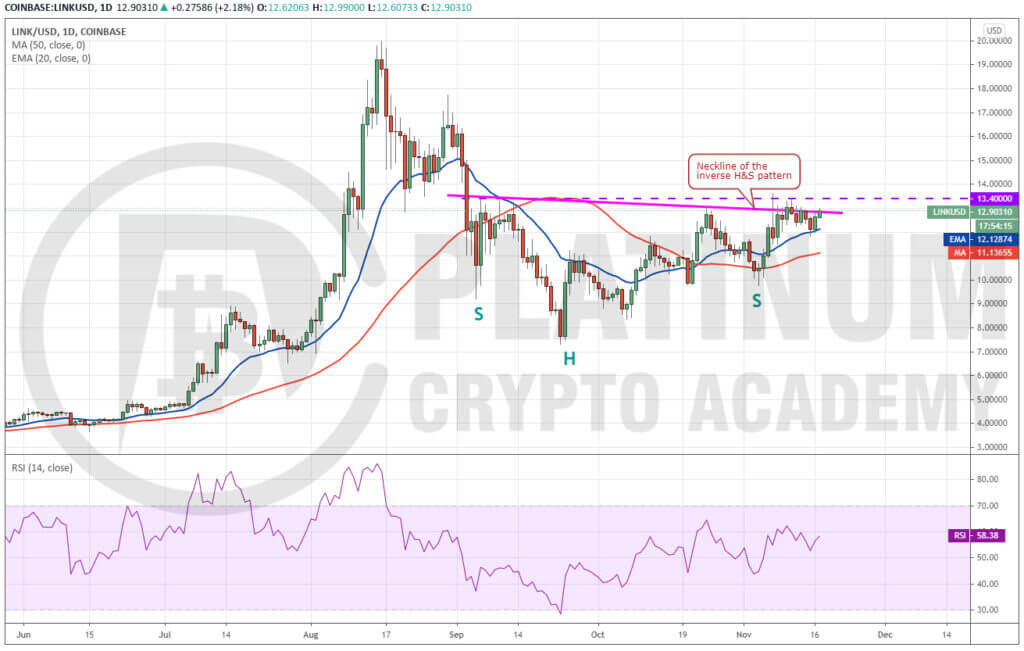
Chainlink has been struggling to break out of the $13.40 resistance for the past few days. However, the positive thing is that the bulls have not allowed the price to sink below the 20-day EMA.
The bulls will now again attempt to push the price above $13.40. If they succeed, the LINK/USD pair will complete an inverse head and shoulders pattern that has a target objective of $19.4888.
Therefore, we retain the buy recommendation given in the previous analysis. The upsloping moving averages and the RSI in the positive zone also suggest that the path of least resistance is to the upside.
Contrary to this assumption, if the price again turns down from the overhead resistance and slips below the 20-day EMA, a drop to the 50-day SMA and then to $9.76 is possible.
Hopefully, you have enjoyed today’s article.
Thanks for reading! Have a fantastic day! Live from the Platinum Crypto Trading Floor.
Earnings Disclaimer: The information you’ll find in this article is for educational purpose only. We make no promise or guarantee of income or earnings. You have to do some work, use your best judgement and perform due diligence before using the information in this article. Your success is still up to you. Nothing in this article is intended to be professional, legal, financial and/or accounting advice. Always seek competent advice from professionals in these matters. If you break the city or other local laws, we will not be held liable for any damages you incur.
