
Bitcoin Trading is very close to a new all-time high. The sharp rally of the past two months has brought back the focus on cryptocurrencies. Crypto has again made it to the front pages of mainstream media, including The Wall Street Journal.
The current crypto bull market has largely been driven by greater adoption by institutional investors. The latest billionaire to invest in Bitcoin Trading is Ricardo Salinas Pliego, the second-wealthiest man in Mexico. Pliego tweeted that he held 10% of his liquid portfolio in Bitcoin Trading.
PayPal’s crypto adoption has been one of the major factors that started the current bull run. A report by crypto investment firm Pantera Capital highlights that PayPal has been buying about “70% of the new supply of bitcoins.” According to Pantera, the remaining 30% of the supply is being lapped up by Cash App. This has created a shortage, which could be one of the contributing factors to the recent rally.
As cryptocurrencies pick up momentum, they are likely to attract several speculative traders who would again jump in and attempt to become rich overnight. After the rally in top cryptocurrencies, soon, the underperformers and shitcoins may start soaring. This usually happens at the end of a bull market. Hence, traders should be careful not to get sucked into such a rally with dreams of earning quick money.
Let’s analyse the charts of the top-5 cryptocurrencies to determine whether the rally could continue or is a top around the corner.
BITCOIN TRADING – HOW TO TRADE BTC/USD
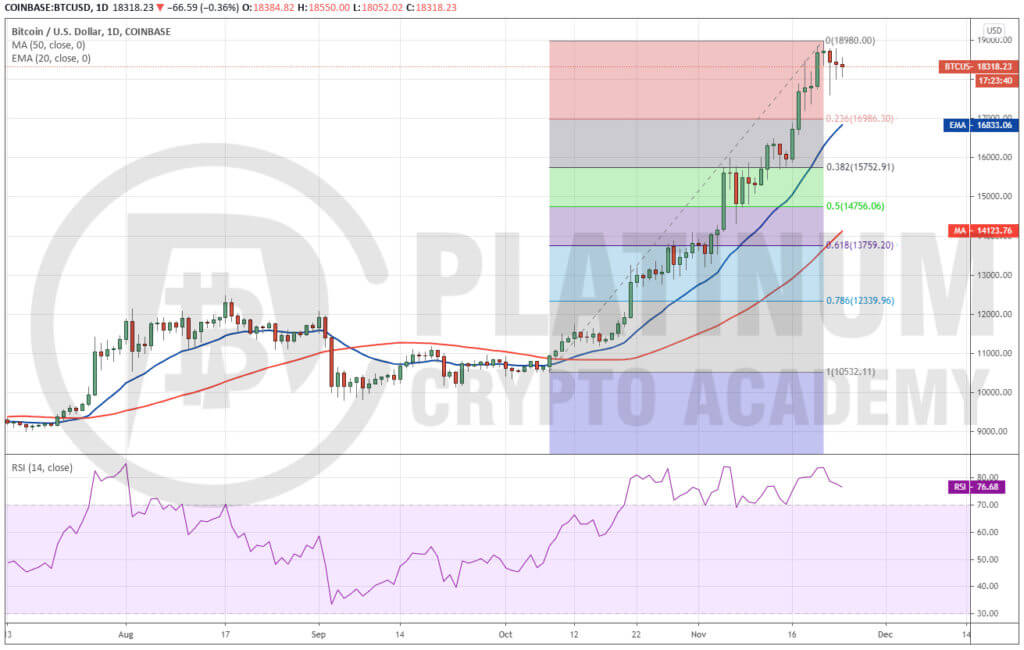
We had suggested traders close their remaining position in the previous analysis because we expected $17,200 to act as a stiff resistance. However, that did not happen. The bulls easily pushed the Bitcoin Trading above the $17,200 mark on November 17.
Bitcoin trading reached a high of $18,980 on November 21, just shy of the all-time high at $19,891.99.
The price formed a Doji candlestick pattern on November 21 and the bears attempted to start a correction on November 22, but the bulls aggressively purchased at lower levels. This suggests that bulls are accumulating on dips.
However, the bears are defending the higher levels and that led to another Doji candlestick on November 23. This suggests indecision among the bulls and the bears about the next directional move.
The upsloping moving averages and the RSI in the overbought zone suggest that bulls are in control. Hence, if the bulls can propel the price above $19,000, a rally to $20,000 is possible.
This level is likely to act as a psychological barrier but if the bulls can drive the price above it, the momentum is likely to pick up and the Bitcoin trading pair could form a blow-off top, which is usually followed by a sharp correction.
On the other hand, if the bears sink the Bitcoin trading below $17,610.77, it would indicate the start of a correction that could reach the 20-day EMA. If the Bitcoin trading pair rebounds off this level, the bulls will again try to propel the Bitcoin trading to new all-time highs.
However, if the 20-day EMA gives way, the pair could dip to the 38.2% Fibonacci retracement level at $15,752.91. We do not find any reliable setup at the current levels, hence, we are not suggesting a trade in it.
ETHEREUM TRADING – HOW TO TRADE ETH/USD
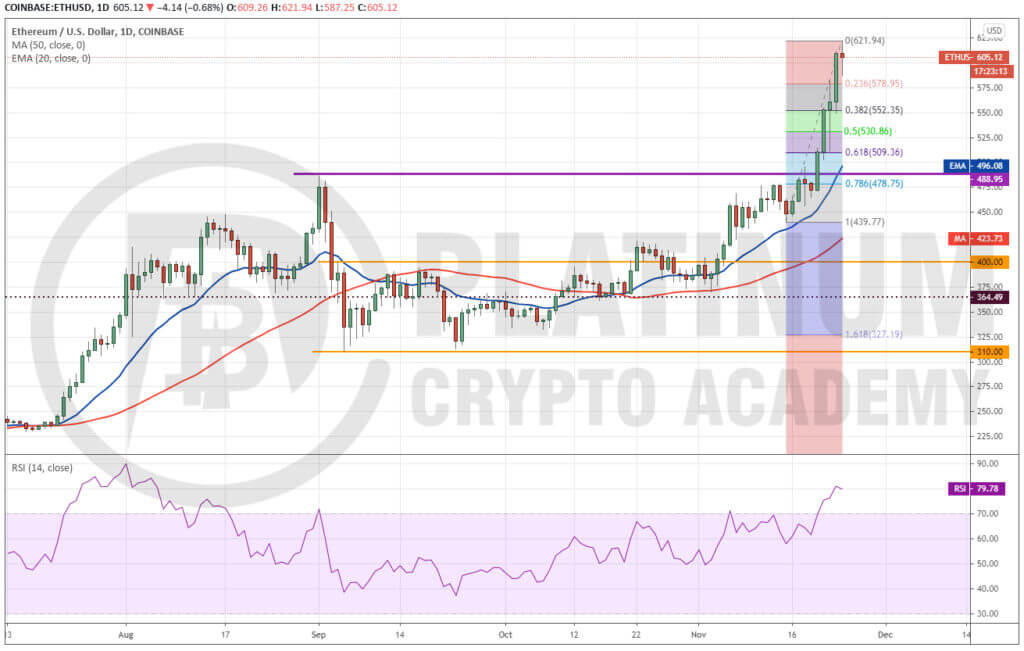
We had advised traders to keep their partial long positions open because we were expecting the bulls to make another attempt to break out of $488.95. That happened on November 20 and the Ethereum trading soared above $500.
The momentum picked up after this and Ether has quickly reached above the $621 level. There is a minor resistance at $625 but if the bulls can push the Ethereum trading price above it, the rally could reach $800.
However, after the recent leg of the rally, the RSI has risen close to 80, which suggests panic buying among the bulls.
Vertical rallies are not sustainable and they usually result in waterfall declines. Therefore, traders can book partial profits close to the current levels and keep only a small position open with a trailing stop-loss.
If the Ethereum trading pair turns down from $625, the first support is at the 38.2% Fibonacci retracement level at $552.35, and if this support cracks, the correction could deepen to $530.86.
We do not believe in chasing prices higher. Hence, traders should book profits and sit on the sidelines and wait for the next opportunity.
XRP TRADING – HOW TO TRADE XRP/USD
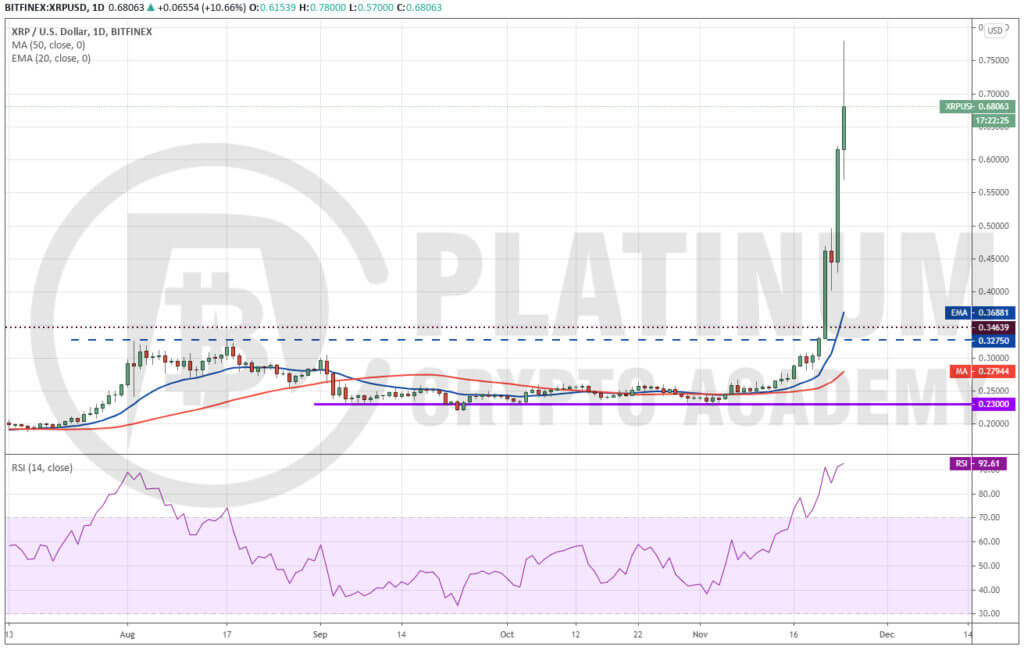
Traders who had purchased according to our recommendation are sitting on huge profits within a short period. We were expecting XRP trading to reach $0.3275 and face some resistance there, before moving to $0.40, as suggested in the previous analysis.
However, the XRP trading pair soared 40.10% on November 21 and followed it up with another 38.20% rally on November 23. Today, the price surged to $0.78, which is just below the target objective of $0.79.
We believe that the current momentum is not sustainable. The RSI has reached above 92 levels, which shows that the rally is overextended in the short-term.
Therefore, traders can book profits on about 80% of the position at the current levels and keep only a nominal 20% position open to ride the move higher, if that happens. On the downside, the first support would be at the psychological level of $0.50.
We do not suggest buying again on dips because the moves are likely to be volatile with a high risk.
BITCOIN CASH TRADING – HOW TO TRADE BCH/USD
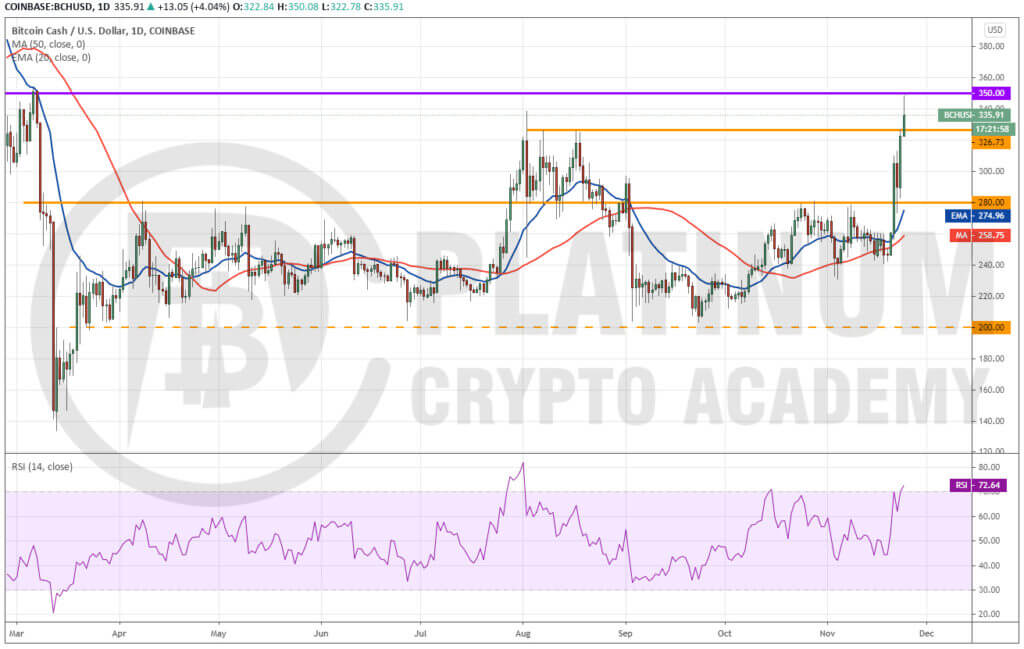
We had recommended traders to buy Bitcoin Cash if it sustains above $280 for a few hours. Traders got that opportunity on November 21 and again on November 22.
The sharp up-move of the past four days has pushed the Bitcoin Cash trading to $350. This level may act as resistance but if the bulls can thrust the Bitcoin Cash trading above it, the next leg of the uptrend to $400 and then to $500 is possible.
Traders can wait for a few hours and if they find the bulls struggling to sustain the price above $350, partial profits can be booked and the rest of the position can be trailed higher with a suitable stop-loss.
However, if the Bitcoin Cash trading pair sustains above $350, traders can keep a close stop-loss on half position and trail the rest with a slightly wider stop-loss.
If the Bitcoin Cash trading turns down from the current levels, the first support is at $326.73, and if this support cracks, the decline could reach $300.
CHAINLINK TRADING – HOW TO TRADE LINK/USD
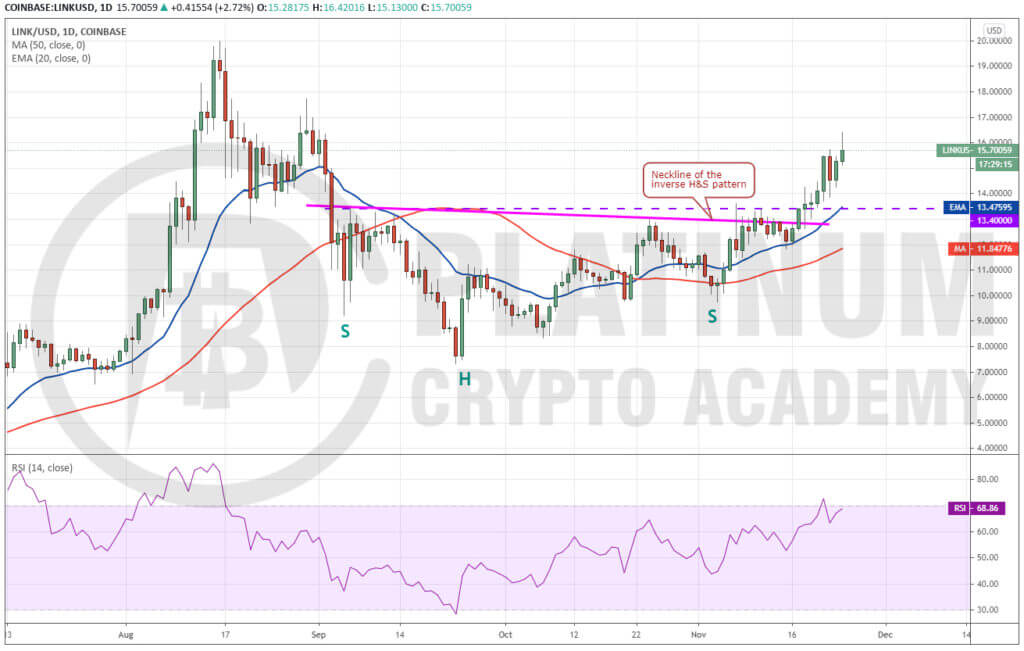
Chainlink trading closed (UTC time) above $13.40 on November 18 and that provided an opportunity to the traders to buy as recommended by us in an earlier analysis.
This move completed the bullish inverse head and shoulders pattern that has a minimum target objective of $19.4888. The upsloping moving averages and the RSI in the overbought territory suggest an advantage to the bulls.
The buyers may face resistance at $18, hence, traders can watch this level closely. If they find that the bulls are struggling to push the Chainlink trading above it, partial profits can be booked.
Unlike other top cryptocurrencies, the Chainlink trading pair has been a slow mover. This suggests a lack of urgency to buy it. Hence, traders can keep a stop-loss at breakeven to protect their capital in case of any sharp turnaround.
Hopefully, you have enjoyed today’s article.
Thanks for reading! Have a fantastic day! Live from the Platinum Crypto Trading Floor.
Earnings Disclaimer: The information you’ll find in this article is for educational purpose only. We make no promise or guarantee of income or earnings. You have to do some work, use your best judgement and perform due diligence before using the information in this article. Your success is still up to you. Nothing in this article is intended to be professional, legal, financial and/or accounting advice. Always seek competent advice from professionals in these matters. If you break the city or other local laws, we will not be held liable for any damages you incur.
