Hi Crypto Network,
Stephen Roach, a faculty member at Yale University and former chairman of Morgan Stanley Asia, has warned about the US dollar losing its de facto status as the reserve currency of the world. That could result in a 35% decline in the value of the dollar, according to Roach.
CRYPTO MARKET ANALYSIS
If such a move happens, it could trigger a currency crisis, sending investors scurrying into gold and Bitcoin.
In a note, Ray Dalio’s Bridgewater Associates has cautioned that investors might be staring at a “lost decade” in the stock markets. If this happens, the institutional investors will have to look at other assets in search of yields. At that time, cryptocurrencies are likely to stand out.
Out of the total Bitcoins mined till date, 11.4 million are held by long-term investors and 3.7 million are perceived to be lost, according to Chainalysis. That leaves only 3.5 million available for trading. And if the institutions jump in, the demand will shoot up and the supply will fall short. This is likely to send Bitcoin prices to the moon.
Although the regulators in the US have disallowed several Bitcoin ETF applications in the past, WisdomTree Investments has again filed an application to invest in Bitcoins but with a minor twist. Instead of being a crypto-only ETF, the fund provider wants to cap Bitcoin investments at 5% of the total fund, with the rest being reserved for the four commodity sectors.
The long-term picture undoubtedly looks bullish but does the short-term also indicate an up move? Let’s find out.
HOW TO TRADE BITCOIN
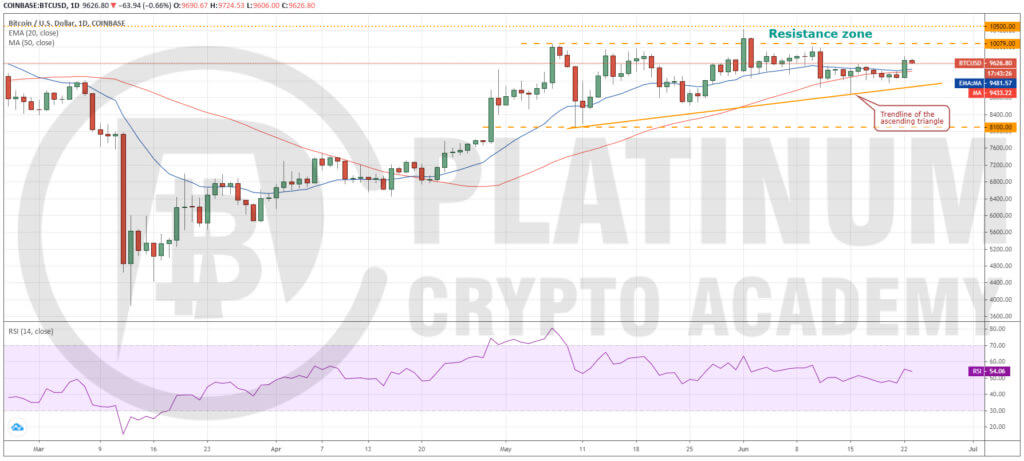
Although Bitcoin had been trading below the moving averages for the past few days, the bears could not take advantage of it. This suggests a lack of sellers at lower levels.
The markets do not remain in a state of limbo for a long time. As the bears could not sink the price lower, the bulls stepped in and pushed the price above the moving averages on June 22.
However, even the bulls are not going to have it easy at higher levels because the bears will aggressively defend the $10,000-$10,500 levels.
Still, if the bulls can break out of $10,000, it could offer a buying opportunity to the traders. On a breakout of the resistance zone, the BTC to USD pair is likely to pick up momentum and rally towards $12,000.
The moving averages are flat and the RSI is just above the midpoint. This suggests a balance between bulls and bears. This balance will be broken if the price sustains above $10,000 or breaks below $8,895.01.
Until a breakout happens, the traders can remain on the sidelines because the price action inside the ascending triangle is likely to be volatile.
HOW TO TRADE ETHEREUM
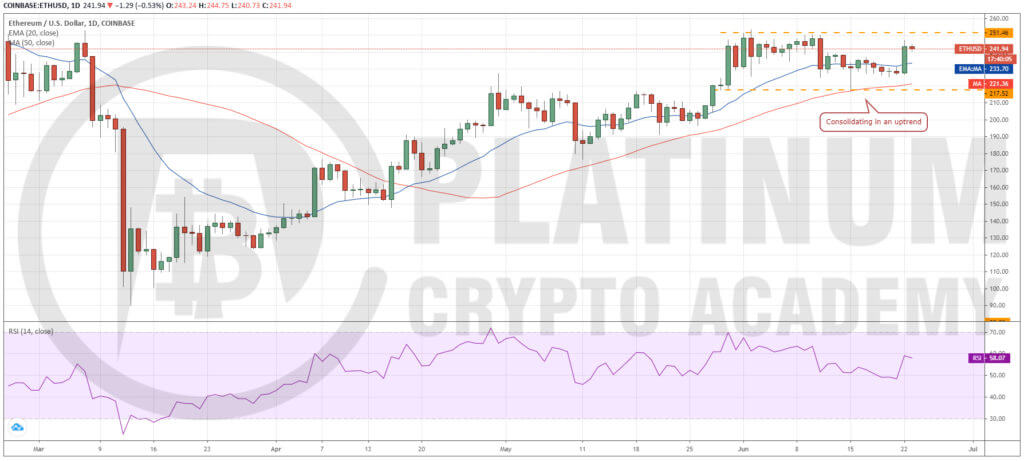
Ether is currently range-bound between $251.46 and $217.52. This consolidation could either be a temporary stop before the uptrend resumes or it could be a short-term top and the prices could turn down from here.
Although it is difficult to predict the direction of the breakout, the charts can provide some insight. The price has largely remained near the top of the range and any dips to the bottom have been purchased aggressively.
This suggests that the bulls are buying on dips as they expect higher levels in the future. A consolidation near the overhead resistance indicates strength and it increases the possibility of a breakout of the range.
The RSI has jumped into the positive territory and the 20-day EMA has started to slope up marginally. This suggests that the indicators are also pointing towards a possible breakout.
In our previous analysis, we had suggested buying on a breakout and close (UTC time) above $240 and the trade triggered on June 22. The stop-loss can be kept at $225.
If the bulls can propel the pair above $253.46, the next target level to watch out for is $280.
HOW TO TRADE XRP
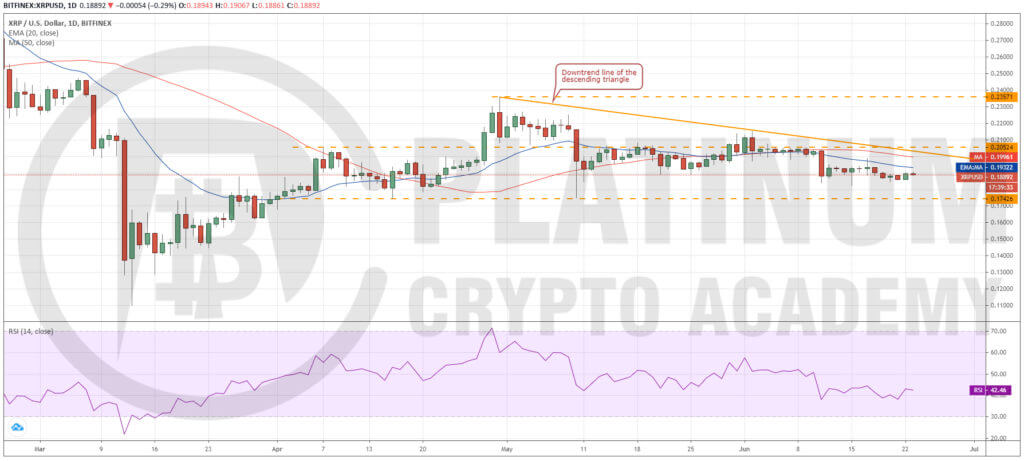
While the top two cryptocurrencies are showing signs of life, XRP continues to underperform.
The price has been trading below the 20-day EMA for the past few days, which suggests a lack of buying interest at higher levels.
If the bulls fail to scale the price above the 20-day EMA within the next few days, the possibility of a decline to $0.17426 is high.
The XRP to USD pair is forming a descending triangle pattern that will complete on a breakdown and close (UTC time) below $0.17426. The target objective of this breakdown is $0.11281.
This bearish view will be invalidated if the pair rises above the moving averages and the downtrend line of the descending triangle in the next few days. Such a move will indicate that bulls are back in action.
If the rally picks up momentum, it can reach $0.23571. However, as the pair has been in a long-term downtrend, traders should wait for a change in trend before buying it.
HOW TO TRADE BITCOIN CASH
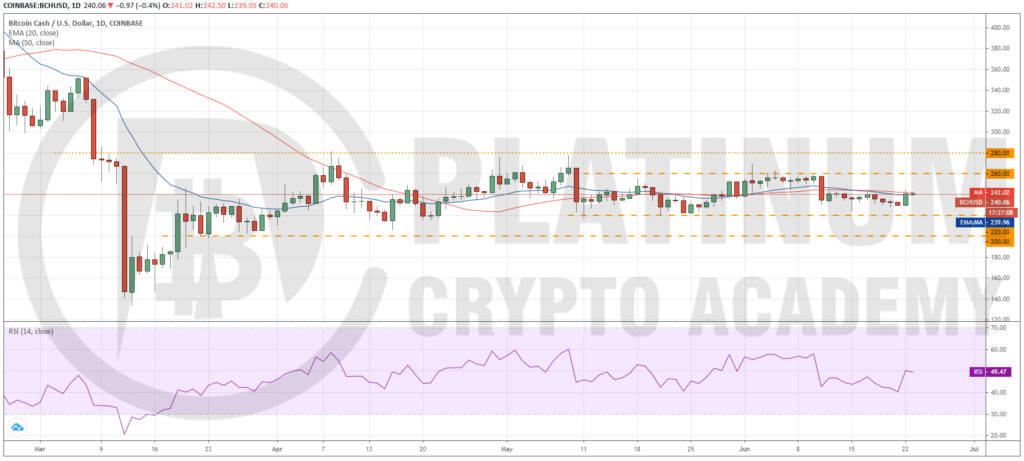
Bitcoin Cash has largely been trading between $220 and $260 for the past few days. This suggests a balance between supply and demand.
Currently, the price has risen to the moving averages. A breakout of the moving averages will carry the price to $260 but if the BCH to USD pair turns down from the current levels, it can again drop to $220.
The moving averages are flat and the RSI is close to the 50 levels, which suggests that the range-bound action is likely to continue for a few more days.
While trading in a range, the best place to buy is on a bounce off the support of the range. Another opportunity arises when the price breaks out of the range because it indicates that the bulls have overpowered the bears and that results in a strong up move.
As the price is currently stuck near the midpoint of the range, the traders can stay on the sidelines.
HOW TO TRADE BITCOIN SV
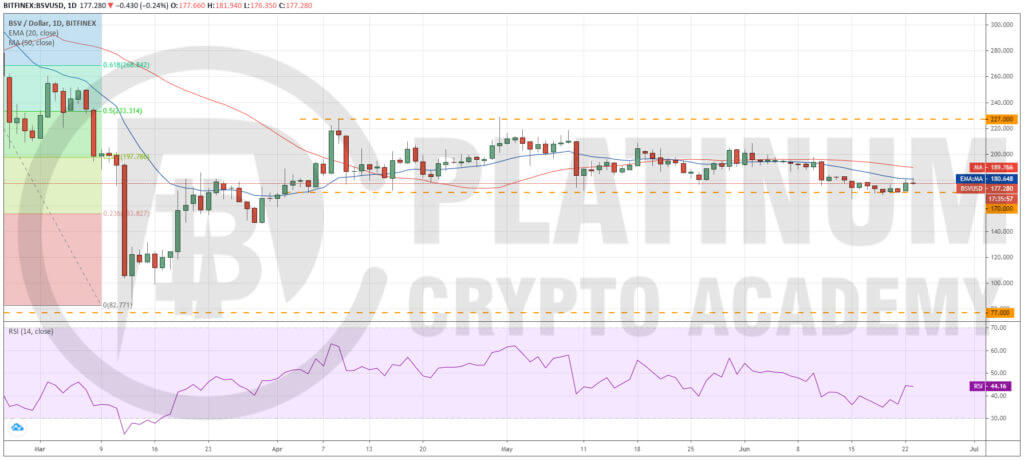
Bitcoin SV corrected to the bottom of the large $170-$227 range last week. However, the bears could not sink the price below the range, which suggests a lack of sellers at lower levels.
After remaining subdued from June 19-21, the BSV/USD pair jumped higher on June 22. This suggests that some aggressive bulls have purchased as the pair held on to the support of the range.
Nonetheless, the bulls are facing selling at the 20-day EMA. If the price turns down from the 20-day EMA, the bears will make another attempt to sink the price below $170. If successful, a new downtrend is likely.
On the other hand, a breakout of the 20-day EMA will signal strength. Above this level, the pair can move up to $200 and then to the top of the range at $227.
Hopefully, you have enjoyed today’s article. Thanks for reading!
Have a fantastic day!
Live from the Platinum Crypto Trading Floor.
Earnings Disclaimer: The information you’ll find in this article is for educational purpose only. We make no promise or guarantee of income or earnings. You have to do some work, use your best judgement and perform due diligence before using the information in this article. Your success is still up to you. Nothing in this article is intended to be professional, legal, financial and/or accounting advice. Always seek competent advice from professionals in these matters. If you break the city or other local laws, we will not be held liable for any damages you incur.
