
Hi Crypto Network,
Ethereum price analysis is an interesting topic at the moment with the hot topic of anything related to Decentralized Finance (DeFi). Ethereum being the gateway to Defi you can see a real boom going on. if you haven’t considered Defi at this stage with the proposed 8% pa returns then you must have been hiding under a rock.
You only have to examine things like the monstrous Tether market cap, the recent surge in the price of Chainlink as well as DeFi platform Celsius recently exceeding $1 billion in crypto deposits, it’s clear that these are well-founded claims. The Twitter hacking of several high-profile names in the US was the highlight news of last week. However, the direct financial damage due to this hacking was limited as the hackers could only scam 12 Bitcoins from the people. A very important point to note is that throughout theordeal, Bitcoin’s price hardly budged, which shows that the asset has matured. Previously, a piece of similar news would have tanked the price.
CRYPTO MARKET ANALYSIS – ETHEREUM PRICE ANALYSIS
China is reported to have made significant progress in the development of digital yuan. It has already roped in large corporations to test the digital payment system. The success of the digital yuan will force other nations to also follow suit with their own central bank digital currency.
Morgan Creek Digital co-founder Anthony Pompliano believes that the money printing by the US Federal Reserve has caused the “devaluation of the currency.” Therefore, he advocates people to get out of cash and invest in assets such as stocks, real estate, gold, Bitcoin, etc., that are likely to rise over the long-term.
Bitcoin, which was projected as digital gold has failed to rise along with gold, which is at a nine-year high. This suggests that investors are not convinced that Bitcoin is a safe haven. Therefore, for the past few days, Bitcoin is more correlated with the US equity markets rather than gold. However, Binance CEO Changpeng Zhao is confident that “the safe haven properties of Bitcoin will come through over time.”
ETHEREUM PRICE ANALYSIS
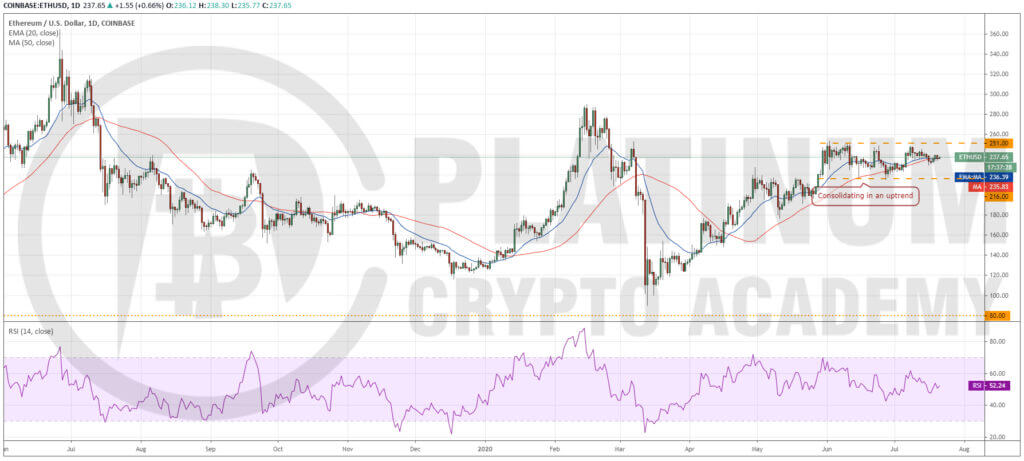
Ethereum price analysis has been trading between $216 and $251 for the past few days. When the range is well specified, traders should wait for the breakout of the range to establish fresh positions.
In this case, a breakout of $251 is likely to signal resumption of the uptrend with the immediate target at $290 and if that level is crossed, the rally can even extend to $320 and then $360. These are only possibilities, hence, once the trade has been initiated, stops should be trailed higher.
However, instead of a breakout, if the bears sink the Ethereum USD pair below $216, it will signal a reversal. Such a move can drag the price towards $180 and lower. Therefore, traders should avoid buying after the price sustains below $216.
Until either scenario plays out, the pair will continue its range-bound action. Ethereum price analysis being Inside the range, the best place to buy is when the price rebounds off the support, which in this case is $216. Buying close to the support provides a logical stop-loss, which is just below the range, hence, the risk to reward ratio becomes attractive.
Taking positional trades when the price is close to the centre of the range is not advisable as the risk to reward ratio is not in favour of the traders and the price action is random and volatile..
HOW TO TRADE – BITCION PRICE ANALYSIS
There is no change in the range-bound price action of Bitcoin, the only thing is that the intraday range is getting tighter. When the daily ranges are so small, barring the scalpers, option sellers, and the high-frequency trading systems, other traders will find it difficult to make money.
Hence, the volume drops and when that happens, the depth in the market thins out. Usually, the markets are shaken out of this slumber by the entry of a large trader who decides to buy or sell in large quantity that causes the range to expand.
After the range expansion, if other traders who are waiting on the sidelines also decide to join, a trending move could start. However, if other traders are not keen to make an entry, no follow up buying is seen and the price again slips back into the range.
Sometimes, the other traders might take the opposite position to that of the breakout. If that happens, the price action reverses quickly, trapping several traders who are then forced to cover their position, which results in a sharp rally.
Therefore, it is better to wait for the breakout to sustain for a day before jumping on the bandwagon. The breakout from a tight range might not offer a sharp pullback, hence, traders should be willing to buy as the rally continues.
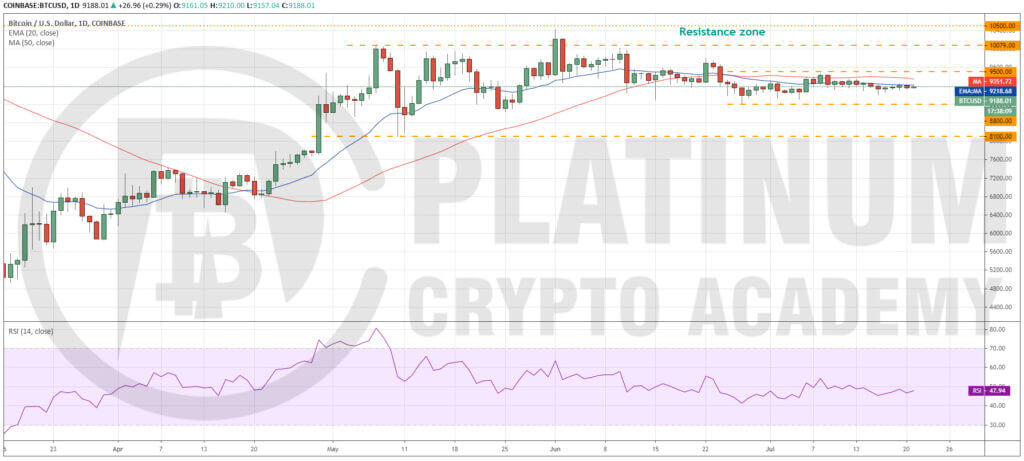
Traders should watch the $8,800 level on the downside and $9,500 level on the upside. If the BTC to USD pair breaks out of $9,500 and sustains the higher level for a day, long positions can be initiated with a stop-loss below $8,800.
Although the bulls might face stiff resistance in the $10,000-$10,500 zone, the momentum is likely to break above this zone.
Conversely, if the price dips below $8,800 and sustains the lower levels for a day, the possibility of a drop to $8,100 levels increase. If the price rebounds off this level aggressively, it could be a buying opportunity.
On the other hand, if the bears sink the pair below $8,100, long positions should be avoided as the next support on the downside is way lower at $6,500.
HOW TO TRADE – XRP PRICE ANALYSIS
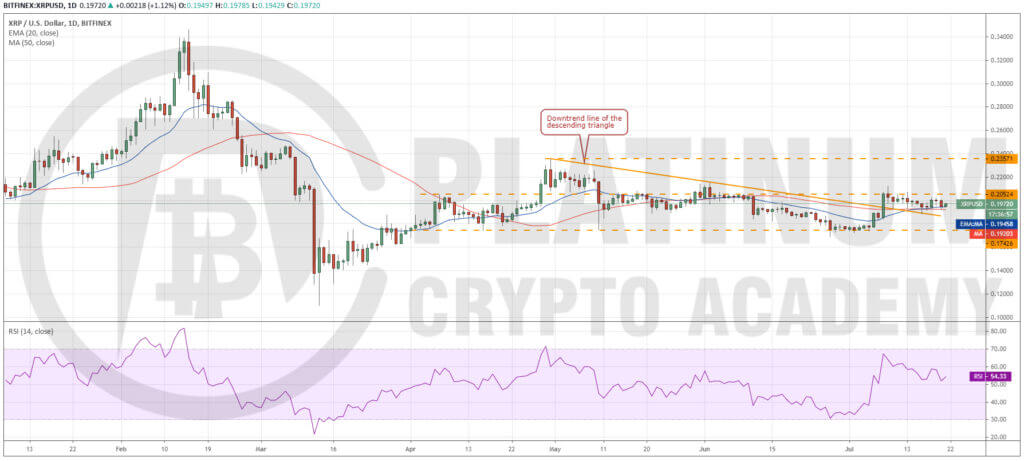
Although XRP has been trading above the downtrend line and the moving averages since breaking out on July 8, the bulls have not been able to propel and sustain the price above $0.20524, which suggests a lack of demand at higher levels.
As long as the price sustains above the 20-day EMA, the possibility of a break above $0.20524 is high. If that happens, the XRP to USD pair can move up to $0.23571. This level might act as resistance but if crossed, the pair is likely to pick up momentum.
If the bears sink the pair below the moving averages, it will signal weakness and could drag the price down to the critical support at $0.17426.
Therefore, if the pair sustains below the moving averages for two days, traders who have initiated long positions as suggested in our previous analysis can close half of the positions and hold the rest with the stops at $0.17.
If $0.17 also gets taken out, then the downtrend can extend to $0.14 and below that to $0.12.
HOW TO TRADE – BITCOIN CASH PRICE ANALYSIS
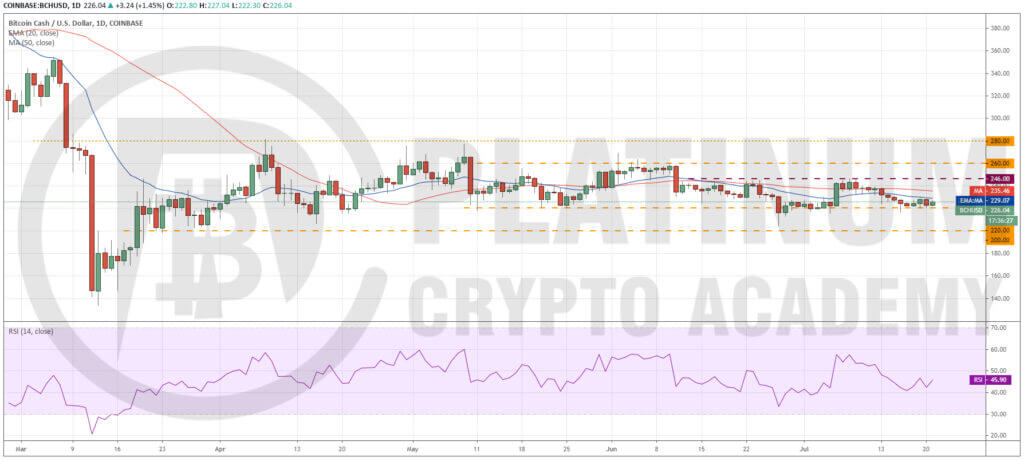
Bitcoin Cash has dropped to the bottom of the $220-$246 range. Although the bulls have held the support at $220 for the past few days, they have not been able to push the price above the 20-day EMA.
This suggests that the bears are selling on any minor rallies to the 20-day EMA. If the bears sink the price below $220, the BCH to USD pair can drop to the next support at $200. A break below this support will signal the start of a possible downtrend.
Conversely, if the pair rebounds of the $200 support, it could offer a buying opportunity with the stop placed just below the support. However, traders should buy on the way up following a rebound rather than buying on the way down.
A break above the moving averages will indicate that buying interest is back and that could carry the price to $246 and above it to $260. If both these levels are crossed, the final resistance is $280, above which a new uptrend is likely to begin. A close (UTC time) above $280 could also provide a buying opportunity to the traders.
HOW TO TRADE – BITCOIN SV PRICE ANALYSIS
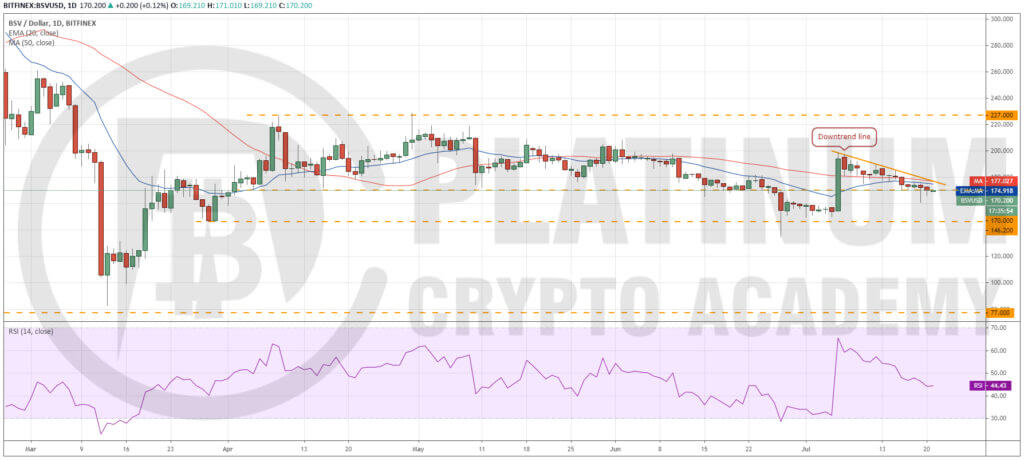
There has been no follow up buying in Bitcoin SV after its stellar rally on July 6. This suggests that traders are not positive that the up move can continue. This has resulted in profit booking by the traders that has dragged the price to the $170 support.
On July 19 and 20, the bears broke below this support but the bulls purchased the dips, which suggests some buying at lower levels. However, if the bulls do not push the price above the downtrend line within the next few days, the possibility of a break below $170 increases.
Below this support, the next level to watch out for is $146.20 because if this also gives way, a new downtrend is likely. The next support on the downside is way lower at $110.
Conversely, if the bulls can push the price above the downtrend line, a move to $200 is possible. However, as the BSV/USD pair has been an underperformer, we shall wait for the sentiment to turn bullish before suggesting a trade in it.Hopefully, you have enjoyed today’s article. Thanks for reading! Have a fantastic day! Live from the Platinum Crypto Trading Floor.
Earnings Disclaimer: The information you’ll find in this article is for educational purpose only. We make no promise or guarantee of income or earnings. You have to do some work, use your best judgement and perform due diligence before using the information in this article. Your success is still up to you. Nothing in this article is intended to be professional, legal, financial and/or accounting advice. Always seek competent advice from professionals in these matters. If you break the city or other local laws, we will not be held liable for any damages you incur.
