Hi Crypto Network,
The coronavirus pandemic has resulted in a state of panic across the world. This has resulted in a sharp selloff in the equity markets, which have seen their worst corrections in decades. The commodity markets and even gold have not been spared in the carnage, which shows that the traders are not differentiating between risky assets and safe havens.
To counter the spread of the virus, various cities and in some cases, the whole nation has been locked down. This will put huge economic stress on the economy and some analysts expect that a recession is likely. The US Federal Reserve has launched a massive quantitative easing program and resorted to two emergency rate cuts this month. However, the equity markets have not obliged with a reversal.
This shows that the markets either want more stimulus or are not convinced that this is the right approach to tackle the current situation. While the added stimulus might provide some respite in the short-term, it is likely to pose a serious problem in the future, which might lead to another crisis.
The crypto markets, barring the massive sell-off on March 12, have been holding up quite well. This shows that long-term investors believe that this asset class will benefit the most as investors lose confidence in the central banks. In the short-term, cryptocurrencies might witness sharp volatile moves but this fall is one of the best opportunities to buy for the long-term. The traders can wait for a bottom to be confirmed before buying. Let’s analyse the charts of the major cryptocurrencies to spot the critical levels to watch out for.
BTC/USD
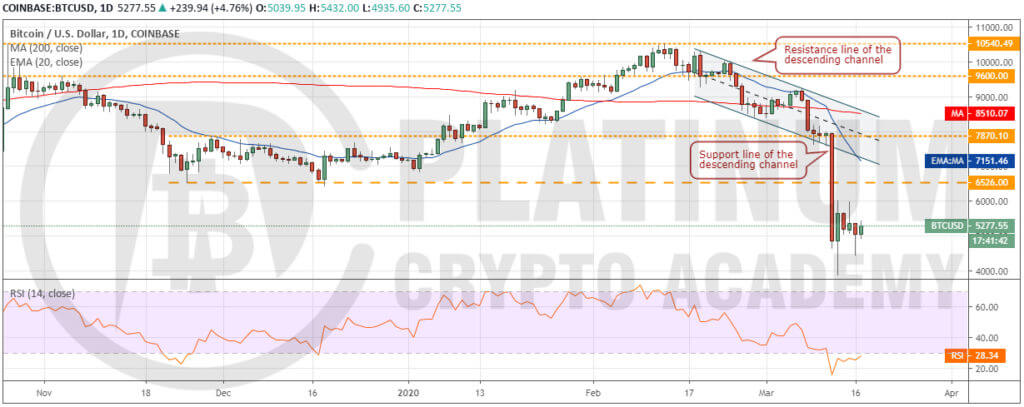
Though the bulls held the support line of the descending channel from March 9 to 11, they could not achieve a strong rebound. This invited selling by the aggressive bears and on March 12, Bitcoin broke below the descending channel and the next support at $6,526.
The panic-driven selling dragged the cryptocurrency to $3,858 on March 13 where buyers stepped in. This is a positive sign as it shows demand on strong dips. However, the relief rally from the lows has not been able to scale and sustain above $6,000. This shows that investors are accumulating on dips and are not buying at higher levels.
The bears again attempted to sink the BTC to USD pair on March 16 but we like the way the price rebounded off $4,432.30 levels. We expect the bulls to buy on dips closer to $4,500 and the bears to sell on minor rallies to $6,000. This points to a possible range-bound action for the next few days.
A consolidation near the lows is a part of the bottoming process, which will complete on a breakout above $6,000. Long-term investors can accumulate on dips below $5,000 in phases. However, keep the position size small as the trend remains down and another leg down cannot be ruled out.
ETH/USD
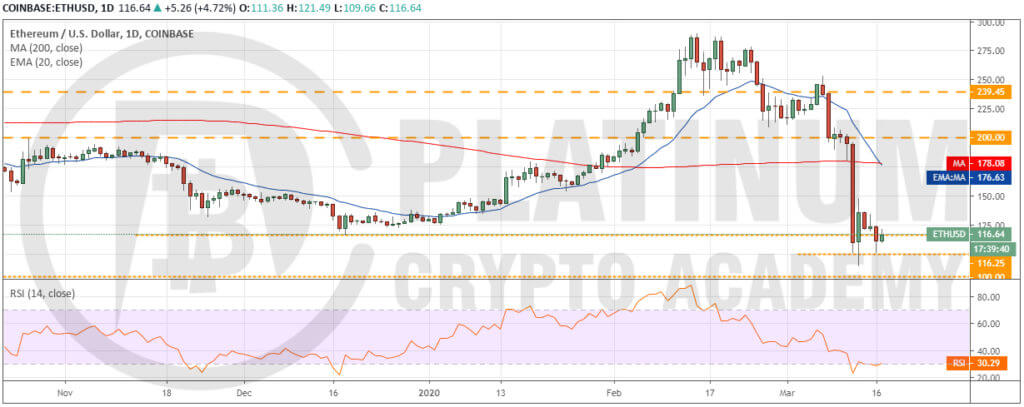
Ether held the 200-day SMA until March 11 but the bulls could not achieve a strong rebound off it, which suggests a lack of buyers at higher levels. On March 12, the biggest altcoin succumbed to selling pressure and plunged 43.32% in a single day.
This was followed by further selling on March 13 that dragged the price to $90, however, buying emerged at lower levels, which helped Ether stage a relief rally that topped out at $148.
For the past three days, the ETH to USD pair has lost some ground, which shows a lack of buyers at higher levels. Currently, the bulls are attempting to keep the price above $100. If this support breaks, the decline can extend to $80.
Alternatively, if $100 support holds, the price might move up to $150 and remain range-bound between these levels for a few days. We suggest traders wait for a reversal pattern to form before initiating long positions.
XRP/USD
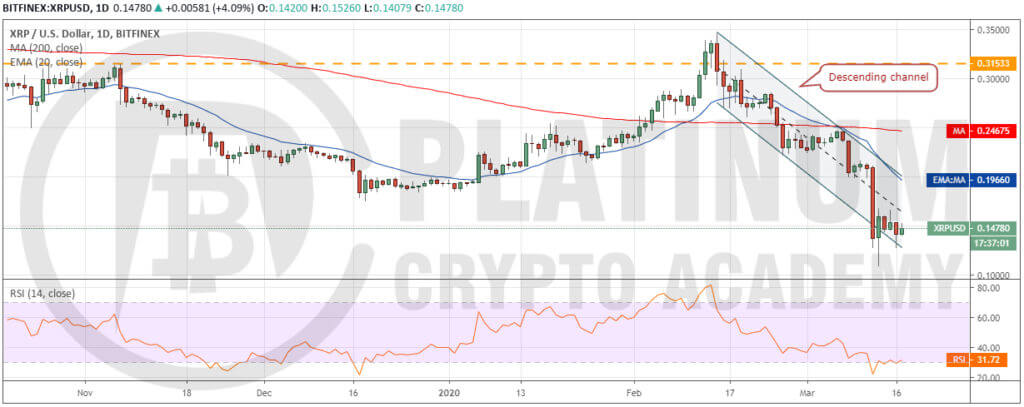
The $0.20-$0.176 support zone cracked on March 12 as XRP plummeted to $0.12825. This was followed by further selling on March 13 when the altcoin made a new multi-year low at $0.11004.
Buying at $0.11004 helped stage a recovery that reached $0.16759 and the price re-entered the channel. However, the bulls have not been able to build upon this pullback. This shows a lack of buyers at higher levels.
The bears attempted to sink the price again on March 16 but the bulls bought the dip to the support line of the descending channel. This is a positive sign as it shows that the bulls are not waiting for a deep correction to step in.
A break above $0.16759 will be the first sign that bulls are back in the game. We suggest traders wait for the price to breakout out the descending channel before buying.
BCH/USD
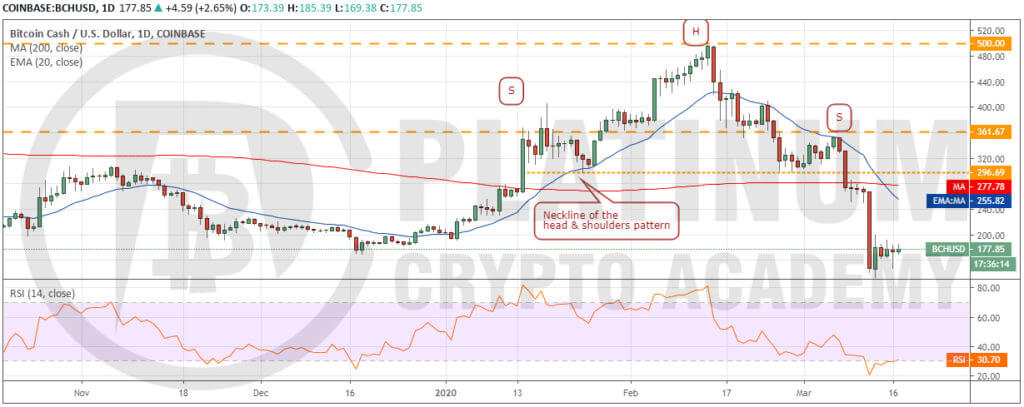
The failure of the bulls to push the price back above the 200-day SMA and the neckline of the head and shoulders (H&S) pattern attracted sellers. Bitcoin Cash plunged 45.05% on March 12. It made a low of $133.67, which is close to $95.85, the target objective of the H&S pattern.
For the past three days, the price has been trading inside the $133.67-$200 range. A breakout of this consolidation can carry the altcoin to the 20-day EMA, which is likely to act as a stiff resistance.
On the other hand, a break below $133.67 will resume the downtrend and can sink the price to $95.85. As the trend is down, we suggest traders wait for a reversal pattern to form before initiating long positions.
LTC/USD
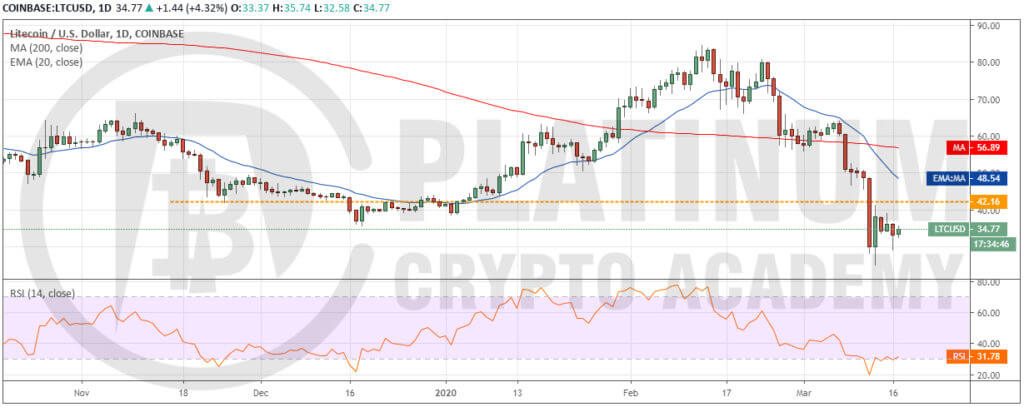
Litecoin has dethroned Bitcoin SV as the fifth cryptocurrency by market capitalization. On March 12, the altcoin also sold-off along with the overall market and plunged below critical support levels.
On March 13, buyers finally stepped in closer to $25 levels. However, the relief rally fizzled out at $41.31, which shows a lack of buyers at higher levels. Since then, the price has been trading inside the intraday range formed on March 13.
The attempt by the bears to resume the downtrend on March 16 found buyers at $29.17, which is a bullish sign. This shows that traders are not waiting for a deeper correction to start buying. A break above $41.31 will be the first sign that bulls are back in the game. We will wait for the price to scale above the 20-day EMA before recommending a trade in it.
Hopefully, you have enjoyed today’s article. Thanks for reading!
Have a fantastic day!
Live from the Platinum Crypto Trading Floor.
Earnings Disclaimer: The information you’ll find in this article is for educational purpose only. We make no promise or guarantee of income or earnings. You have to do some work, use your best judgement and perform due diligence before using the information in this article. Your success is still up to you. Nothing in this article is intended to be professional, legal, financial and/or accounting advice. Always seek competent advice from professionals in these matters. If you break the city or other local laws, we will not be held liable for any damages you incur.


