
Bitcoin has been stuck in a narrow range for the past few days, indicating that traders are not booking profits as they anticipate another leg higher. The crypto markets remain cheerful in the hope that a spot Bitcoin exchange-traded fund will see the light of day.
Institutional investors seem to be using the dull price action of the past few days to accumulate Bitcoin. CoinShares weekly report released on July 10 shows an inflow of $136 million into digital asset investment products last week. That takes the total inflow of the past three weeks to $470 million.
In another sign of hoarding of Bitcoin by large investors, behavioral analytics platform Santiment said that sharks and whales, owning between 10 and 10,000 Bitcoin, have added 71,000 Bitcoin since mid-June.
The buyers received a stamp of approval from Standard Chartered, which said in a recent report that Bitcoin could soar to $50,000 this year and extend the up-move further to close the next year at $120,000. The bank expects miners to sell less Bitcoin as they maintain their cash flows with increased profitability. That could cause a supply and demand imbalance, fuelling the rally.
Another bullish voice was that of Binance CEO Changpeng “CZ” Zhao who said in a July 5 “ask me anything” on Twitter that Bitcoin follows a four-year bull cycle and that is likely to continue. Zhao expects 2025 to be the year of the bull for Bitcoin. CZ believes the entry of Blackrock into the crypto space will be “hugely beneficial” for the industry.
However, JPMorgan has a different viewpoint on spot Bitcoin ETFs. In a recent report, the bank said that even if a Bitcoin ETF is approved by the Securities and Exchange Commission, it is “unlikely to be a game changer for crypto markets” as similar products in Canada and Europe had failed to ignite demand.
Could Bitcoin step out of its range and start a trending move over the next few days? Let’s study the charts of Bitcoin and the major altcoins to find out.
BTC/USD Market Analysis
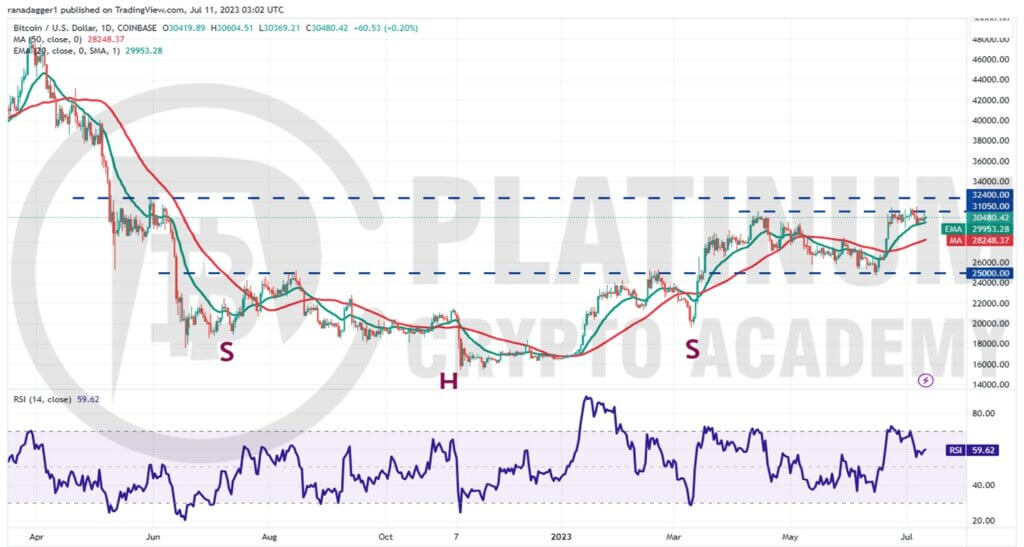
Bitcoin has been consolidating near the overhead resistance of $31,000 for the past few days. Several attempts by the bulls to clear this hurdle were thwarted by the bears but a minor positive is that the sellers could not sink the BTC/USD pair below the 20-day exponential moving average (EMA). This indicates that the sentiment remains positive and traders are buying the dips.
The upsloping 20-day EMA and the relative strength index (RSI) in the positive territory suggest that the path of least resistance is to the upside. If buyers thrust and sustain the price above $31,000, the pair may start the next leg of the uptrend.
There is a minor resistance at $32,400 but it is likely to be crossed. The pair may then soar toward $40,000, where the bears are again expected to mount a strong defense.
Contrary to this assumption, if the price turns down from $31,000 and breaks below the 20-day EMA, it will suggest that short-term traders are booking profits. That could sink the pair to the 50-day simple moving average (SMA). Such a move will suggest that the pair may remain stuck inside the large range between $25,000 and $31,000 for some more time.
ETH/USD Market Analysis
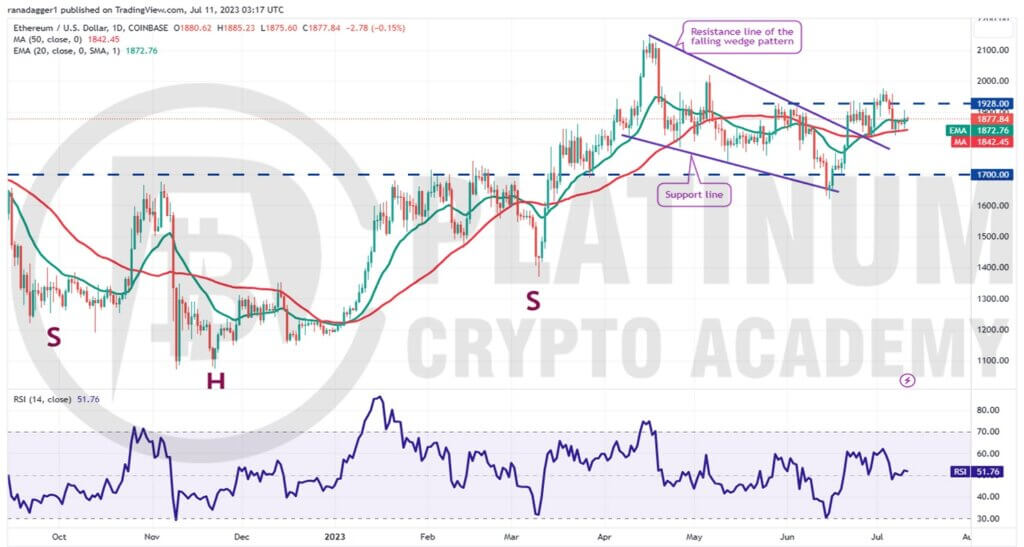
The bulls successfully held the retest of the breakout level from the wedge on June 28 but they could not sustain the rally above the overhead resistance at $1,928. This suggests that the bears remain active at higher levels.
A positive sign in favor of the bulls is that they have not allowed the price to break below the 50-day SMA. This suggests demand at lower levels.
Buying on dips and selling on rallies may keep the ETH/USD pair inside a range for a few days. The flattish moving averages and the RSI near the midpoint also indicate a few days of consolidation.
The next trending move is likely to begin on a break and close above the psychological resistance of $2,000 or on a break below the 50-day SMA. If the price slides below the 50-day SMA, the pair may plummet to $1,700. On the upside, a break above $2,000 could open the doors for a retest of $2,142.
BNB/USD Market Analysis
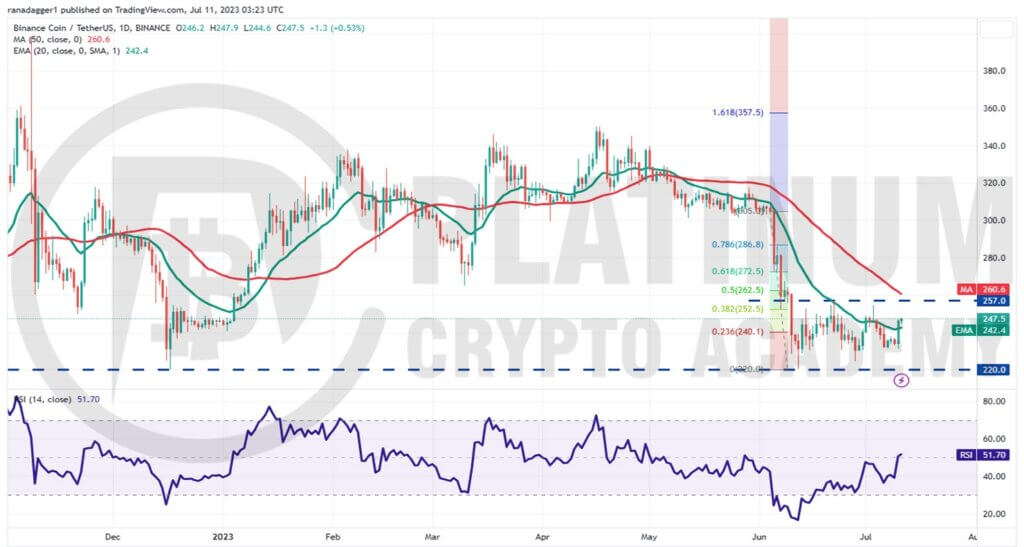
Binance Coin has been ranging between $220 and $257 for the past few days. This indicates that the bulls are attempting to form a base at $220. The 20-day EMA is flattening out and the RSI is near the midpoint, indicating that the selling pressure could be reducing.
The bulls pushed the price above the 20-day EMA on July 10 and will next attempt a break above $257. If they manage to do that, the BNB/USD pair may start a strong recovery. The pair could then climb to the 61.8% Fibonacci retracement level of $272.50.
This is an important level for the bears to defend because if bulls overcome this barrier, the pair may complete a 100% retracement and surge to $305.
Alternatively, if the price once again turns down from $257, it will suggest that the bears are protecting the level with all their might. That may extend the stay inside the range for a few more days. The bears will have to sink the price below $220 to start the next leg of the downtrend to $183.
XRP/USD Market Analysis
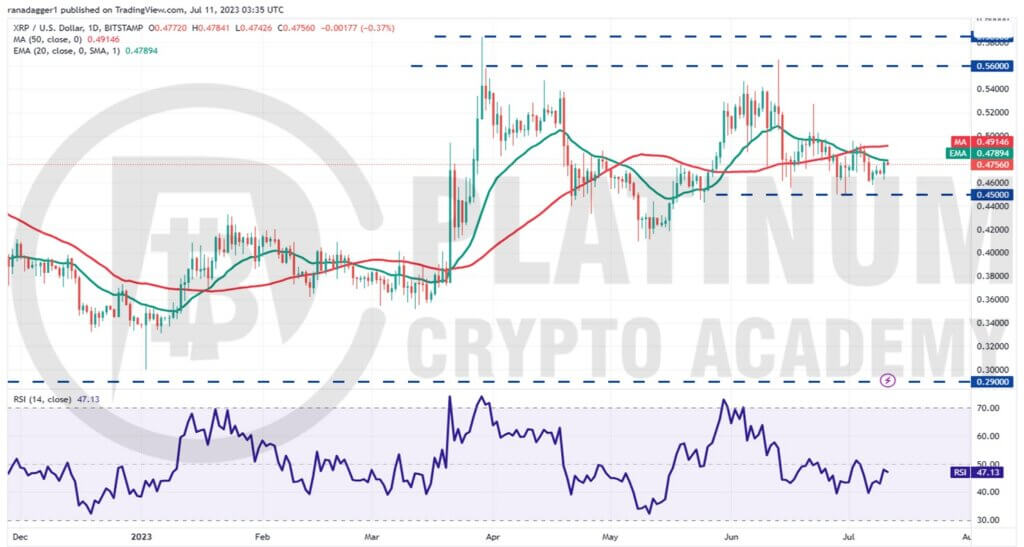
The bears have been defending the 20-day EMA for the past few days, indicating that the sentiment remains negative and relief rallies are being viewed as a selling opportunity. The bears will try to sink XRP to the strong support at $0.45.
This is an important level to keep an eye on because a break and close below it will strengthen the bears and open the doors for a further fall to $0.41. This level is likely to attract strong buying by the bulls.
If bears want to prevent the decline, they will have to propel the price above the moving averages. That could start an up-move to the $0.56 to $0.58 zone. The bulls may face formidable resistance from the bears in this zone.
ADA/USD Market Analysis
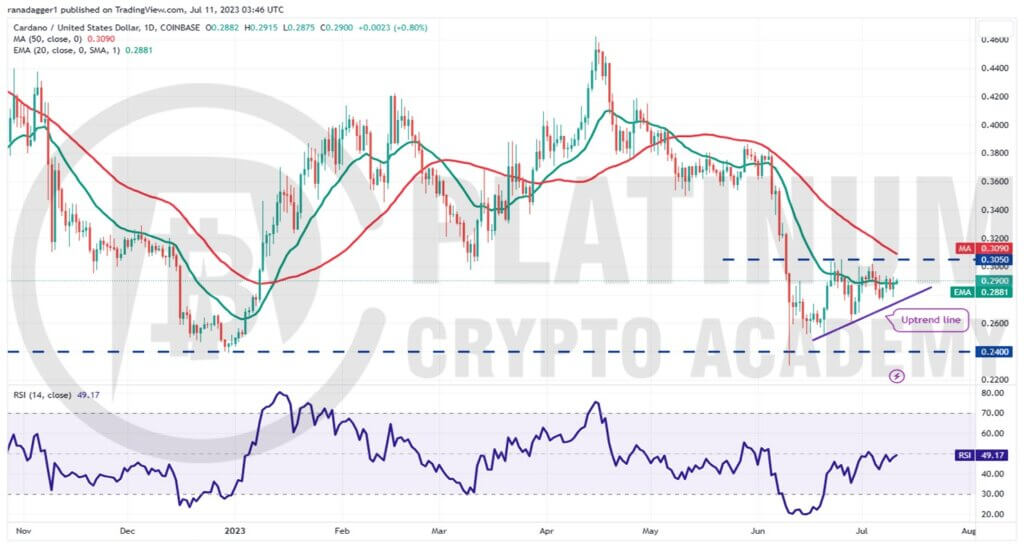
Cardano’s price action of the past few days shows the formation of an ascending triangle pattern, which will complete on a break and close above the overhead resistance of $0.30.
The flattening 20-day EMA and the RSI near the midpoint suggest that the selling pressure is reducing. If bulls drive the price above $0.30, the ADA/USD pair may start an up-move toward the pattern target of $0.36. If this level is scaled, the next stop could be $0.39.
Alternatively, if the price once again turns down from $0.30, it will suggest that the bears continue to defend the level aggressively. That may pull the price to the uptrend line.
A break and close below this level will invalidate the bullish setup. That could sink the pair to the crucial support at $0.24. The bulls are likely to fiercely protect this level.
Hopefully, you have enjoyed today’s article for further coverage please check out our crypto Blog Page. Thanks for reading! Have a fantastic day! Live from the Platinum Crypto Trading Floor.
Earnings Disclaimer: The information you’ll find in this article is for educational purpose only. We make no promise or guarantee of income or earnings. You have to do some work, use your best judgement and perform due diligence before using the information in this article. Your success is still up to you. Nothing in this article is intended to be professional, legal, financial and/or accounting advice. Always seek competent advice from professionals in these matters. If you break the city or other local laws, we will not be held liable for any damages you incur.
