
Bitcoin is nearing its all-time high of $69,000 made in November 2021. While several traders anticipated a new high later in the year, it has come earlier than expected. Traders are enthused with the launch and the solid demand for the spot exchange-traded funds. BlackRock’s Bitcoin ETF is the fastest to reach $10 billion in assets under management (AUM) at about 39 days, according to a X (formerly Twitter) post by the Zero Hedge finance blog. In comparison, the United States’ first gold ETF — SPDR Gold Shares (GLD) — needed more than two years for its AUM to touch $10 billion.
According to CoinShares’ Digital Asset Fund Flows Weekly Report, institutional investors have continued to pump money into digital asset investment products, which saw their second-largest weekly inflows of $1.84 billion last week. The recent inflows have sent the total AUM to $82.6 billion, just short of the peak AUM of $86 billion set in early November 2021. However, some investors seem to be turning bearish in the near term or may be hedging their assets. The short-bitcoin investment products witnessed inflows of $22 million.
It is not only Bitcoin that is seeing action. The memecoins have picked up momentum in the past few days and have been soaring higher. Dogecoin, the original memecoin, has risen more than 100% in the past seven days. Other memecoins such as Pepe, BONK, and SHIB have also seen sharp gains over the past few days. The strong rally in memecoin shows build up of froth, which could result in a short-term correction.
Another reason to be cautious in the near term is that Bitcoin’s open interest surged to $31 billion on March 4, exceeding well above the April 14, 2021 record of $24.3 billion. Although Bitcoin’s long-term story remains intact, volatility is likely to pick up in the short term.
Could Bitcoin make and sustain a new high above $69,000 in the next few days? Will altcoins also continue their move higher? Let’s study the charts to find out.
BTC/USD Market Analysis
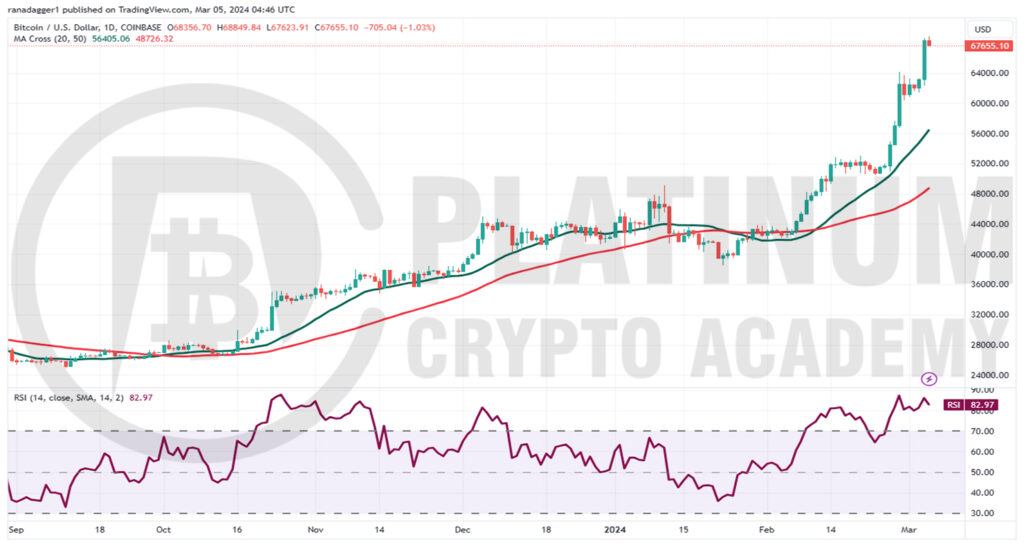
We said in the previous analysis that Bitcoin could reach $60,000, but the price easily surpassed that level. This indicates aggressive buying by the bulls at every higher level.
The momentum picked up after the price bounced off the 20-day simple moving average (SMA) on Feb. 26. Sellers tried to halt the rally near $64,000 on Feb. 28, but the bulls had other plans.
After a minor consolidation, the buyers resumed the uptrend on March 4. The sharp rally of the past few days has sent the relative strength index (RSI) into the deeply overbought territory.
It is difficult to call a top when the market is in a frenzy. If bulls push and maintain the price above $69,000, the BTC/USD pair could rise to $76,000 and later to $80,000.
However, traders should exercise caution because vertical rallies are not sustainable and are followed by sharp declines. The first support on the downside is at $60,000, and then the 20-day SMA at $56,000. A break and close below the 20-day SMA will signal a potential trend change in the short term.
ETH/USD Market Analysis
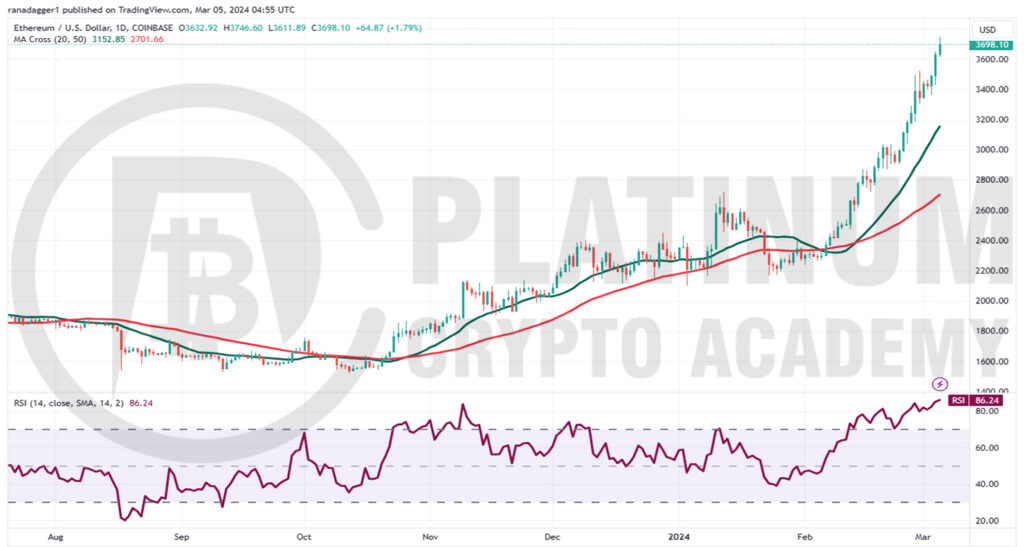
We highlighted in the earlier analysis that if Ether does not lose a lot of ground from $3,000, it could reach $3,500, and that is how it played out. The bears tried to halt the rally at $3,500 on Feb. 29, but the bulls had other plans. They continued their purchase and pushed the price to $3,700 on March 5.
The strong up move of the past few days is looking a little stretched in the near term as the RSI has risen above 86. This suggests a short-term consolidation or correction is possible.
The first strong support on the downside is the 20-day SMA. If the ETH/USD pair rebounds off this level, it will indicate that the sentiment remains positive and traders are buying on dips. That will increase the likelihood of a rally to $4,000 and later to $4,400.
Contrarily, if the price turns down and plummets below the 20-day SMA, it will suggest that the bulls are rushing to the exit. That could deepen the fall to the 50-day SMA and delay the start of the next leg of the uptrend.
BNB/USD Market Analysis
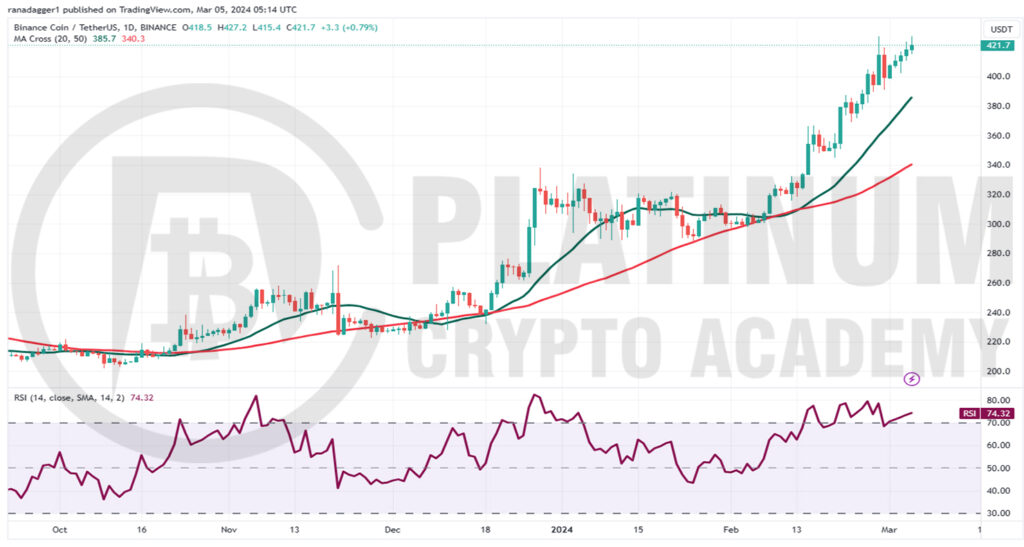
We said in the previous analysis that Binance Coin could reach $400, and it did just that and even exceeded the level. The upsloping moving averages and the RSI in the overbought zone indicate that the bulls remain in command.
If buyers clear the minor hurdle at $427, the BNB/USD pair could reach $460. This level is likely to act as a formidable hurdle, but if bulls bulldoze their way through, the rally could reach $500.
The 20-day SMA remains the important support to watch out for on the downside. If the pair rebounds off the 20-day SMA, it will indicate that the bulls view the dips as a buying opportunity. That will increase the possibility of the continuation of the uptrend.
On the other hand, if the price breaks below the 20-day SMA, several short-term traders may book profits in a hurry. That could intensify selling and sink the price to the 50-day SMA.
XRP/USD Market Analysis
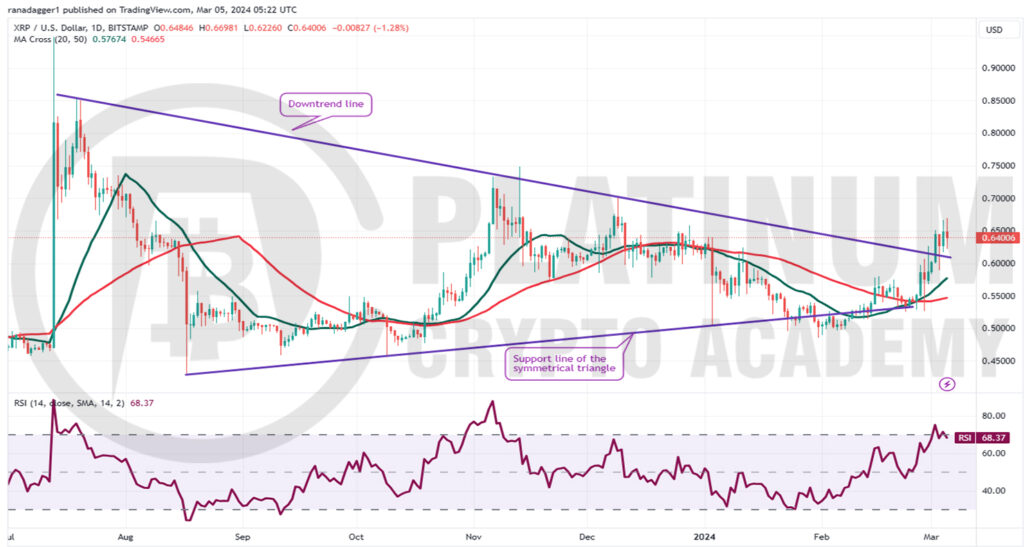
We mentioned in the earlier analysis that the buyers held a minor advantage. The bears tried to sink XRP back below the moving averages on Feb. 28, but the long tail on the candlestick shows solid buying at lower levels.
After a few days of hesitation, the XRP/USD pair rallied above the downtrend line of the symmetrical triangle on March 2. This suggests that the uncertainty has resolved in favor of the buyers.
However, the bears are unlikely to give up easily. They will try to pull the price back into the triangle. If they do that, it will suggest that the recent breakout may have been a bull trap. The pair could then plunge to the support line of the triangle.
On the contrary, if the buyers flip the downtrend line into support, it will signal solid demand at lower levels. If buyers shove the price above $0.67, the pair could reach $0.75 and thereafter $0.85.
ADA/USD Market Analysis
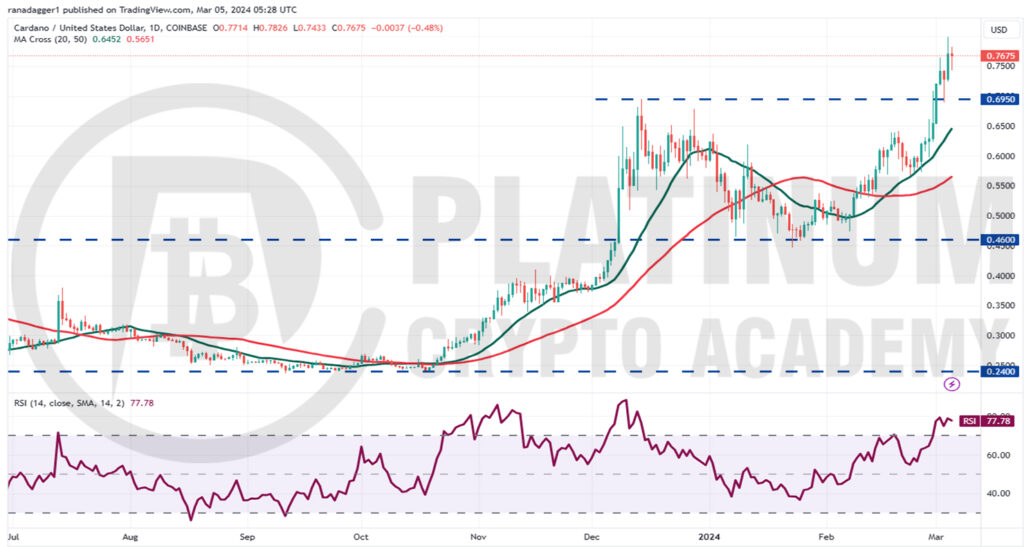
We projected Cardano to rally toward $0.90 in the previous analysis, and it touched $0.80 on March 4. The price has pulled back on March 5, indicating that the bears are active near $0.80.
The crucial support to watch on the downside is the breakout level of $0.70. If bulls flip this level into support, it will enhance the prospects of a rally to $0.90. The rising moving averages and the RSI in the overbought zone indicate that bulls have the edge.
This positive view will be invalidated if the price turns down sharply and breaks below the 20-day SMA. If that happens, it will indicate that the traders are dumping their positions in a hurry. That could start a deeper pullback toward the 50-day SMA.
Hopefully, you have enjoyed today’s article for further coverage please check out our crypto Blog Page. Thanks for reading! Have a fantastic day! Live from the Platinum Crypto Trading Floor.
Earnings Disclaimer: The information you’ll find in this article is for educational purpose only. We make no promise or guarantee of income or earnings. You have to do some work, use your best judgement and perform due diligence before using the information in this article. Your success is still up to you. Nothing in this article is intended to be professional, legal, financial and/or accounting advice. Always seek competent advice from professionals in these matters. If you break the city or other local laws, we will not be held liable for any damages you incur.
