
Bitcoin’s narrow-range trading resolved to the downside on July 24, indicating that bears overpowered the bulls. There was no specific negative news that could be attributed to the drop. Looks like the Bitcoin bulls may have booked profits before the Federal Reserve’s policy decision on July 26.
Market observers expect the Fed to raise rates this week but many believe this to be the last hike of this cycle. If the Fed signals that it is done with its rate hikes, then risky assets could cheer with a further rally. The Dow Jones Industrial Average has already risen for 11 days in a row, notching its longest winning streak since February 2017.
However, a pause in rate hikes could halt the recovery in the U.S. dollar index (DXY). That could be bullish for cryptocurrencies because DXY has an inverse correlation to Bitcoin.
An additional boost to the crypto bulls came from Ripple’s legal victory against the US Securities and Exchange Commission. CoinShares said in its latest weekly report that Bitcoin investment products witnessed an outflow of $13 million but Ethereum and XRP products saw an inflow of $6.6 million and $2.6 million respectively.
Although the short-term price action looks uncertain for Bitcoin, long-term investors continue to hold their positions. Glassnode recently tweeted that the “ Bitcoin Long-Term Holder Supply has reached a new ATH of 14.52M BTC, equivalent to 75% of the circulating supply.”
This week, the Bitcoin network reached an important milestone when block 800,000 was mined on July 24. This means there are only 40,000 blocks left to be mined before the next halving cycle. According to Bitcoinblockhalf.com, it could take roughly 276 days for miners’ rewards to be reduced by half.
investment research firm Fundstrat said in a recent report that Bitcoin could surge to $180,000 before the halving scheduled in April 2024. The firm believes that if a Bitcoin exchange-traded fund is approved, it could boost demand and lead to a supply crunch, boosting prices higher.
Could Bitcoin turn up from the current levels or start a deeper correction? Will altcoins also come under pressure? Let’s study the charts of Bitcoin and the major altcoins to find out.
BTC/USD Market Analysis
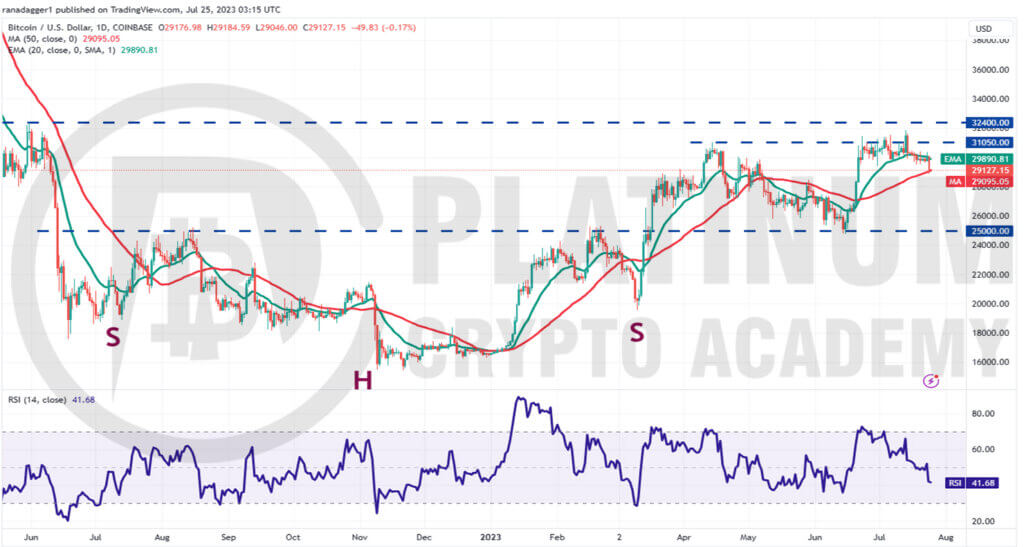
We said in our previous analysis that a break below the 20-day exponential moving average (EMA) could pull the price to the 50-day simple moving average (SMA) and that is what happened.
Buyers propelled Bitcoin above the overhead resistance of $31,050 on July 13 but they could not build upon this strength. The bears sold aggressively and yanked the price back below $31,050 on July 14.
The bears then pulled the price below the 20-day EMA on July 17 and successfully thwarted attempts by the bulls to push the price above it. This indicates that the bears flipped the 20-day EMA into resistance.
The 50-day SMA is the last bastion for the bulls to guard because if it gives way, the selling could intensify and the BTC/USD pair could slump to $27,500. The 20-day EMA has started to slope down and the relative strength index (RSI) has tumbled into the negative territory, indicating that bears are in command.
If bulls want to prevent the downward move, they will have to quickly push the price back above the 20-day EMA. Such a move will indicate aggressive buying at lower levels. The pair may then soar to $31,050.
ETH/USD Market Analysis
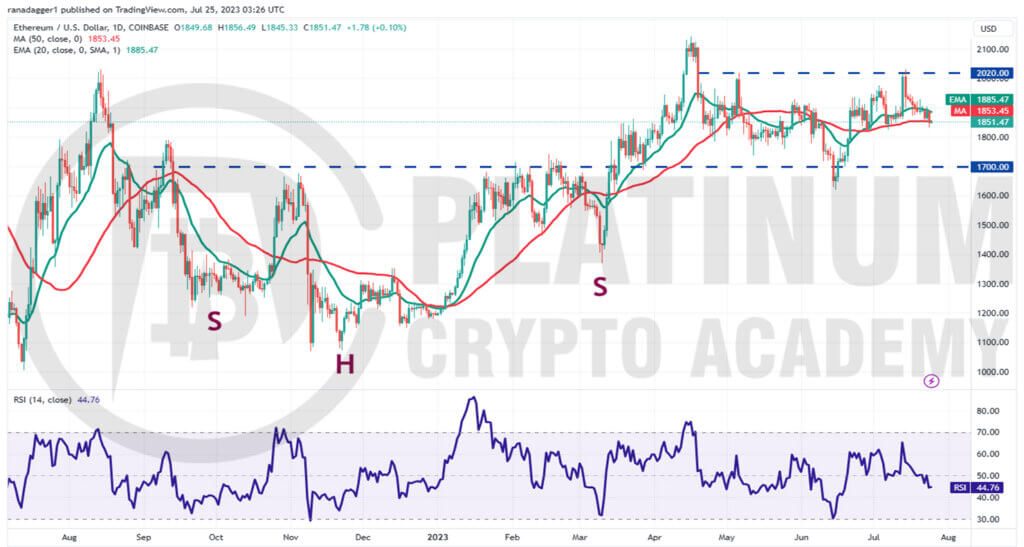
The bulls tried to push Ether above the psychological resistance of $2,000 on July 13 and 14 but the bears held their ground. That started a journey back toward the support at the 50-day SMA.
This is an important level for the bulls to defend because if it cracks, the ETH/USD pair could drop to the next major support at $1,700. That will suggest a range-bound action between $2,020 and $1,700 for some more time.
Alternatively, if the price turns up from the current level, it will suggest that the bulls are fiercely protecting the 50-day SMA. The pair may then rise to the overhead resistance at $2,020.
This remains the key level to keep an eye on. If bulls overcome this barrier, the pair could soar to $2,143 and thereafter attempt a rally to $2,340. But if the price turns down from the overhead resistance, the pair may continue to oscillate between the 50-day SMA and $2,020 for a while longer.
BNB/USD Market Analysis
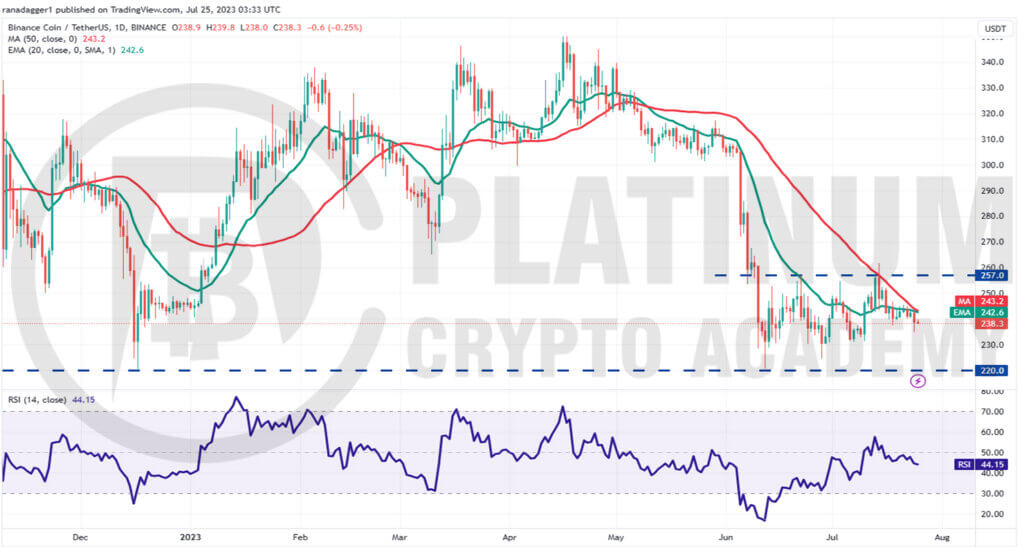
The bulls pushed Binance Coin above the overhead resistance of $257 on July 14 but they could not sustain the higher levels. This shows that the bears are selling on rallies.
The 20-day EMA is flattish and the RSI is just below the midpoint, indicating that the BNB/USD pair may continue to swing between $220 and $257 for a few more days.
The bears will try to sink the price to $230 and thereafter to the crucial support at $220. The bulls are expected to defend this level with all their might because a break and close below $220 may start the next leg of the downtrend.
On the upside, the first sign of strength will be a break above the moving averages. That could open the doors for a retest of the resistance at $257. If this level is scaled, the pair may climb to $285 and subsequently to $305.
XRP/USD Market Analysis
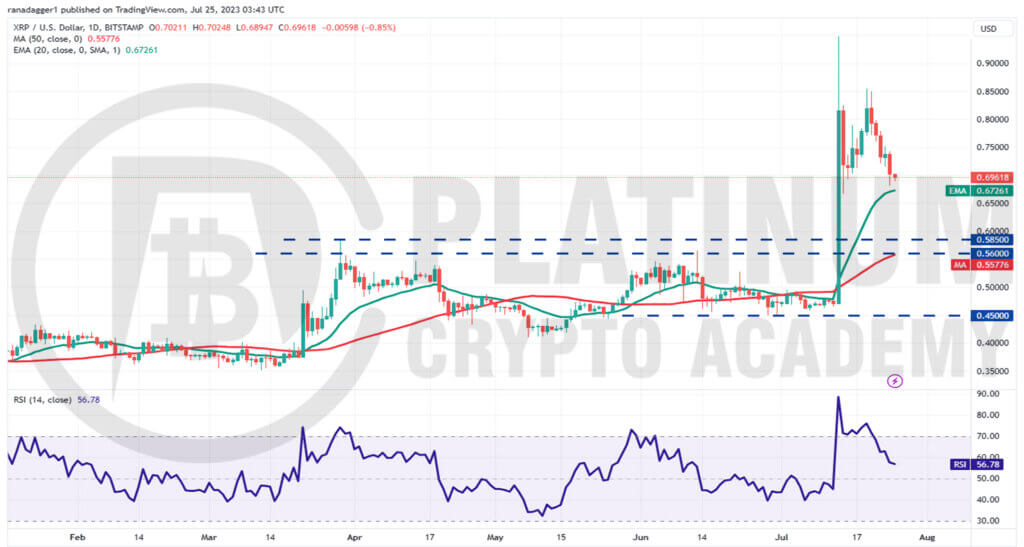
XRP skyrocketed above the overhead resistance zone of $0.56 to $0.58 on July 13 and hit an intraday high of $0.94. The sharp rally may have tempted short-term traders to book profits as seen from the long wick on the day’s candlestick and the correction on July 14.
The bulls tried to resume the up-move on July 19 and 20 but the recovery fizzled out near $0.85. This suggests that bears are active at higher levels.
The failure to resume the up-move may have attracted further selling, which pulled the price to the 20-day EMA. This is an important level for the bulls to defend because a break below it may tank the XRP/USD pair to the breakout level of $0.58.
Contrary to this assumption, if the price turns up from the 20-day EMA, the pair may remain stuck between $0.66 and $0.86 in the near future.
ADA/USD Market Analysis
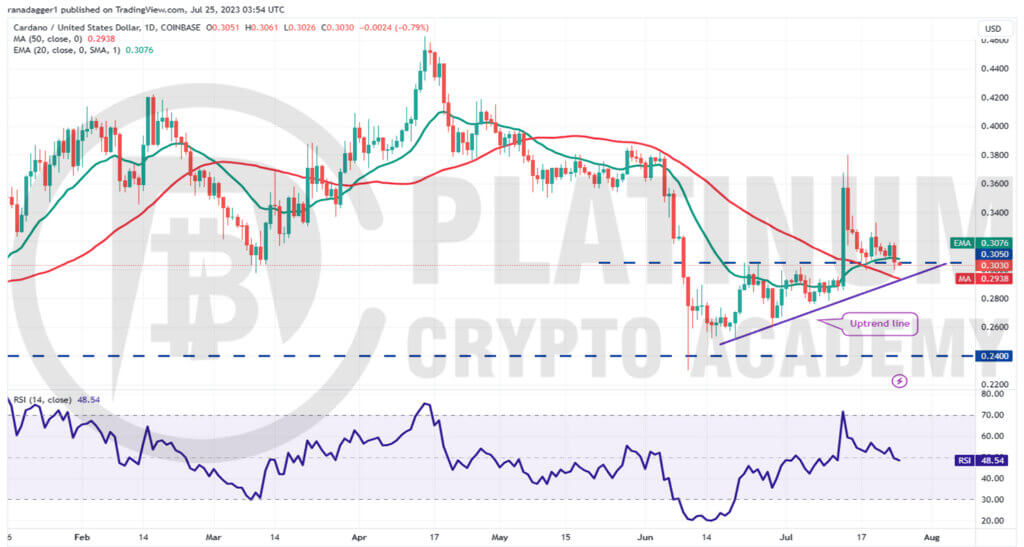
Cardano shot above the overhead resistance of $0.30 on July 13, which completed the bullish ascending triangle pattern. The ADA/USD pair reached its pattern target of $0.36 on the same day and came close to its next target objective of $0.39 as suggested in our previous analysis.
After reaching the target objectives, the bulls seem to have booked profits. That started a sharp pullback, which reached the breakout level of $0.30. The bulls are trying to flip this level into support but they have failed to sustain the rebound. This suggests that higher levels are attracting sellers.
If the price breaks and sustains below the uptrend line, it will signal that the bears are back in the game. The pair may then descend toward $0.26.
This negative view will invalidate in the near term if the price turns up from the current level and breaks above $0.34. The pair could then retest the overhead resistance at $0.38.
Hopefully, you have enjoyed today’s article for further coverage please check out our crypto Blog Page. Thanks for reading! Have a fantastic day! Live from the Platinum Crypto Trading Floor.
Earnings Disclaimer: The information you’ll find in this article is for educational purpose only. We make no promise or guarantee of income or earnings. You have to do some work, use your best judgement and perform due diligence before using the information in this article. Your success is still up to you. Nothing in this article is intended to be professional, legal, financial and/or accounting advice. Always seek competent advice from professionals in these matters. If you break the city or other local laws, we will not be held liable for any damages you incur.
