
Bitcoin has been all over the place leading up to the halving, indicating indecision between the bulls and the bears about the next directional move. Buyers have failed to resume the uptrend, but a positive sign is that they have not allowed Bitcoin to plunge below the crucial $60,000 level.
While Bitcoin remains in a range, several altcoins have faced the brunt of the selling pressure. Several altcoins in the top-20 cryptocurrencies by market capitalization have lost over 20% in the past seven days. That pushed Bitcoin’s market capitalization dominance above 55%, its highest level in three years, according to coinmarketcap data.
The next event being watched closely is the Bitcoin halving. BitMEX co-founder Arthur Hayes wrote in a blog post that Bitcoin is likely to surge in the medium term post halving but may face pressure in the near term. He added that tightening dollar liquidity could result in a “raging firesale of crypto assets.” Therefore, he suggests staying away from trading until May 1.
Markus Thielen, head of research at 10x Research, is cautious for a longer period post-halving. In an analyst note recently, he said that Bitcoin miners could dump roughly $5 billion worth of Bitcoin post halving over four to six months. That could keep Bitcoin stuck inside a range for a few months.
However, analysts remain bullish on Bitcoin for the long term. SkyBridge Capital CEO Anthony Scaramucci, while speaking to CNBC, said that Bitcoin could eventually trade at half the valuation to gold. That means a “six to eight to ten times move” is possible from the current levels. But Scaramucci added that there will be a lot of volatility en route and the move won’t “happen overnight.”
Another bullish voice was that of venture capitalist Tim Draper, who said in an interview with Cointelegraph that strong inflows into Bitcoin exchange-traded funds (ETFs) could propel Bitcoin to $250,000 by the end of 2024.
What are the important support and resistance levels to watch out for in Bitcoin and the major altcoins? Let’s study the charts to find out.
BTC/USD Market Analysis
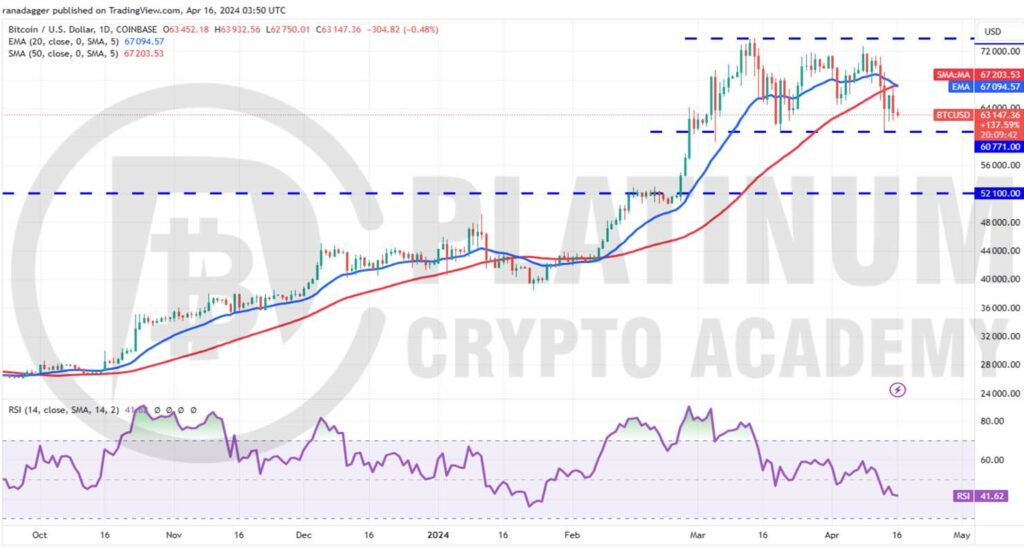
We cautioned traders in the previous analysis that a break below the 50-day simple moving average (SMA) could accelerate selling and pull Bitcoin near $59,224, and that is what happened. The BTC/USD pair fell to $60,822 on April 13.
The pair rebounded off the support, but the relief rally hit a wall at the 20-day exponential moving average (EMA). This suggests that the sentiment remains negative, and traders are selling on rallies.
The bears will again try to sink the price below the $60,771 to $59,224 support zone. If they succeed, the pair could start a down move to $52,100. The downsloping 20-day EMA and the relative strength index (RSI) in the negative territory indicate an advantage to bears.
Contrary to this assumption, if the price rebounds off $59,224, it will signal that the bulls are fiercely defending the support zone. That could keep the pair stuck inside a range between $60,771 and $73,835 for some more time.
The next leg of the uptrend is likely to begin if buyers drive and maintain the price above $73,835, but we give this a low probability of occurring in the near term.
ETH/USD Market Analysis
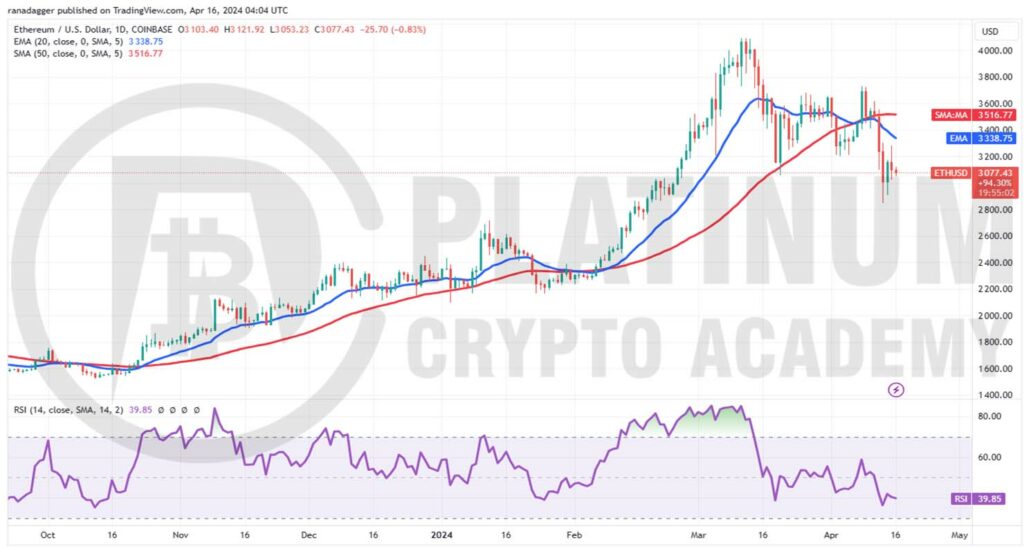
We said in the previous analysis that Ether could plummet to $2,700, and the price touched a low of $2,850 on April 13. The bulls tried to start a recovery, but the bears continue to sell at higher levels, as seen from the long wick on the April 15 candlestick.
The downsloping 20-day EMA and the RSI below 40 suggest that bears have a slight edge. Sellers will again try to sink the price below $2,850. If they manage to do that, the selling could pick up, and the ETH/USD pair may decline to $2,700. This level is likely to act as a strong support.
Contrarily, if the price turns up from the current level or $2,850, it will signal that bulls are trying to arrest the decline. The first sign of strength will be a break and close above the 20-day EMA. That will open the doors for a possible rally to $3,730, where the bears are again expected to mount a strong defense.
The trend will turn in favor of the buyers if they shove the price above the overhead resistance at $3,730.
BNB/USD Market Analysis
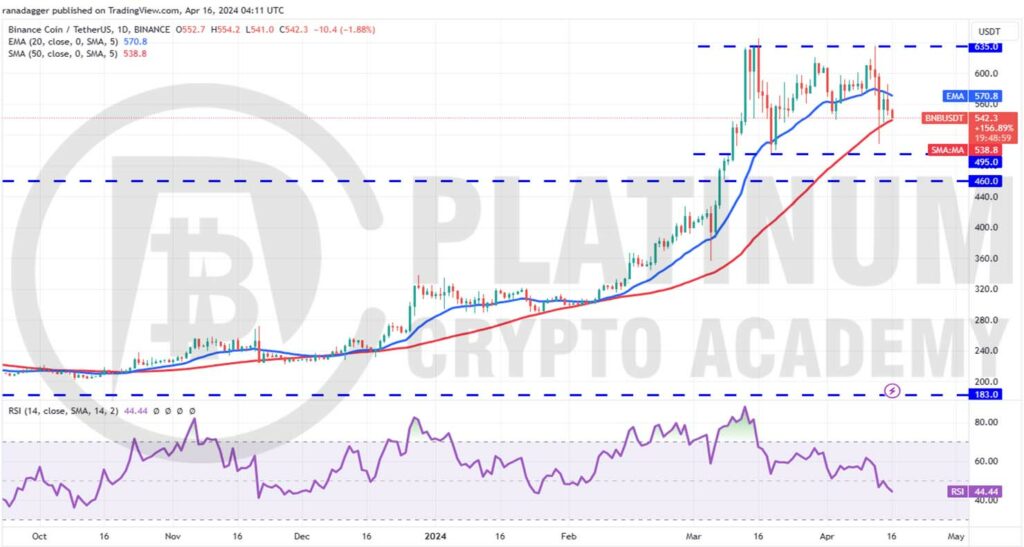
We mentioned in the previous analysis that Binance Coin is likely to remain range-bound between $496 and $645, and that is how it has been.
The bulls tried to propel the price above the overhead resistance on April 12, but the bears held their ground. That may have tempted short-term traders to book profits, which yanked the price to $508 on April 13.
The bulls purchased the dips but could not clear the overhead hurdle at the 20-day EMA on April 15. This suggests that rallies are being sold into.
If the price slips below the 50-day SMA, the BNB/USD pair could plunge to the crucial support at $495. A strong bounce off the support could keep the pair inside the range for some more time.
On the other hand, a slide below $495 will suggest that the bulls are rushing to the exit. That may result in a further decline to $460.
XRP/USD Market Analysis
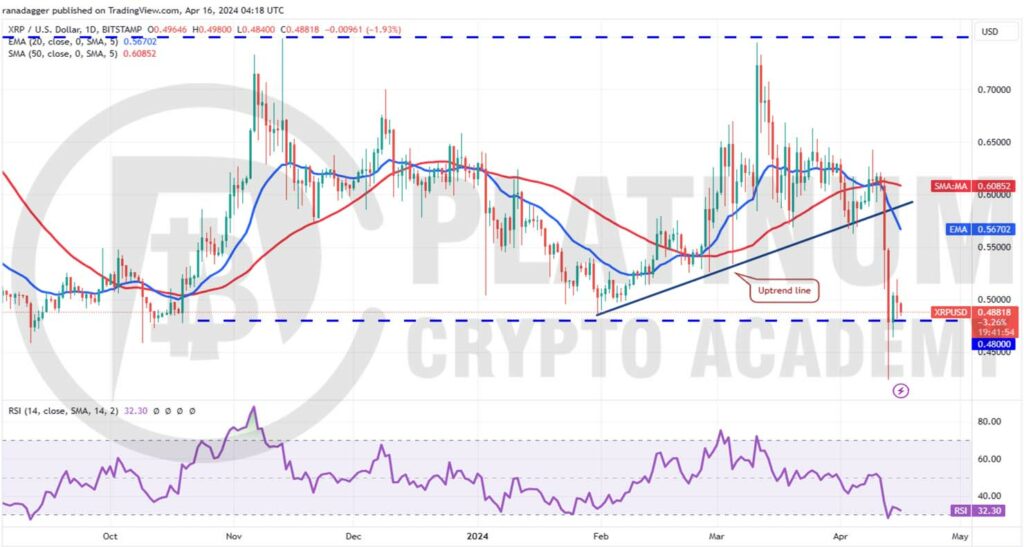
XRP broke below the uptrend line on April 12, resulting in a massive sell-off. That pulled the price below the critical $0.48 support on April 13, but lower levels witnessed solid buying.
The bulls pushed the price back above $0.48 on April 14, but the weak bounce shows that every minor relief rally is being sold into. The price turned down from $0.52 on April 15 and reached near the $0.48 support on April 16.
If this support gives way, the selling could accelerate, and the pair may dump to $0.42. The bulls are expected to defend this level with vigor because a break below it may sink the pair to $0.35.
The bearish view will be invalidated in the near term if buyers push and maintain the price above the 20-day EMA. That will suggest the range-bound action may extend for a few more days.
ADA/USD Market Analysis
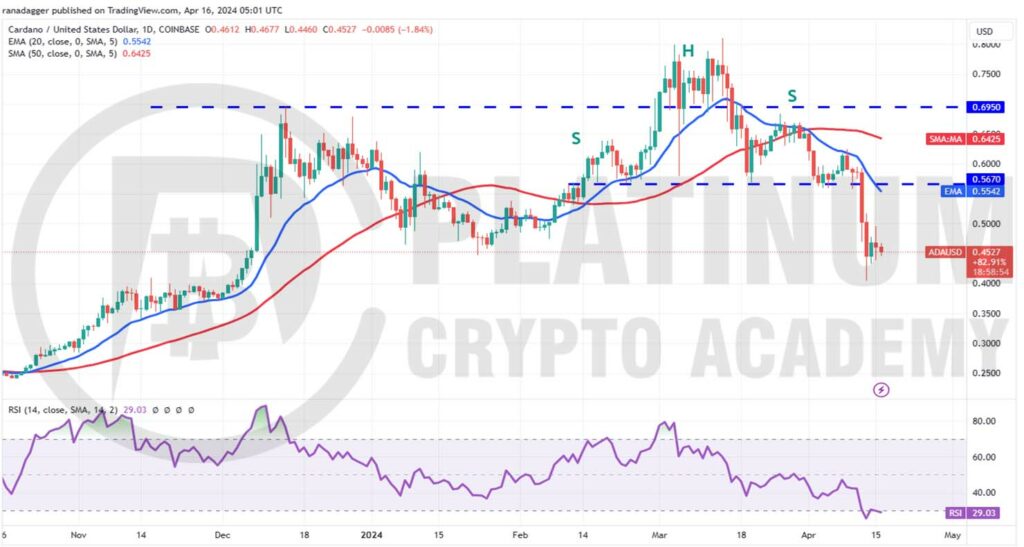
We said in the earlier analysis that a break below $0.56 would complete a bearish head-and-shoulders pattern, opening the doors for a further fall to the pivotal support at $0.45, and that is what happened.
The ADA/USD pair fell below $0.56 on April 12 and extended the decline to $0.40 on April 13. Buyers tried to start a relief rally, which hit a stiff barrier at the psychological level of $0.50. This suggests that the bears are selling on every minor rise.
If the price continues lower and breaks below $0.40, it will signal the start of a downtrend. The pair may then dive to $0.35.
On the contrary, if the price turns up and breaks above $0.50, it will suggest buying at lower levels. The pair may then climb to $0.56, which is again likely to witness a tough battle between the bulls and the bears.
Hopefully, you have enjoyed today’s article for further coverage please check out our crypto Blog Page. Thanks for reading! Have a fantastic day! Live from the Platinum Crypto Trading Floor.
Earnings Disclaimer: The information you’ll find in this article is for educational purpose only. We make no promise or guarantee of income or earnings. You have to do some work, use your best judgement and perform due diligence before using the information in this article. Your success is still up to you. Nothing in this article is intended to be professional, legal, financial and/or accounting advice. Always seek competent advice from professionals in these matters. If you break the city or other local laws, we will not be held liable for any damages you incur.
