
Bitcoin has continued its northward march, indicating that the bulls are in no mood to book profits as they anticipate the rally to extend further. Bitcoin’s bullishness has also rubbed on to select altcoins, which have risen sharply in the past few days, raising hopes that an altcoin season may be around the corner.
Bitcoin’s upcoming halving in April and the expectations of a spot Bitcoin exchange-traded fund being greenlighted in early 2024 are two of the main reasons boosting bullish sentiment. Bloomberg ETF analysts James Seyffart and Eric Balchunas said in a research note on November 9 that there is a 90% chance that a spot Bitcoin ETF will be approved by January 10. They also speculated that there was at least an eight-day window when the Securities and Exchange Commission could “potentially approve all 12 US spot Bitcoin ETF applicants, including Grayscale’s GBTC.”
In another positive news, a Nasdaq exchange filing showed that BlackRock’s ETF division had registered “iShares Ethereum Trust” in the state of Delaware. This suggests that the asset manager wants to create an ETF to hold Ether. This move triggered widespread buying as it shows that BlackRock is bullish on the prospects of the crypto space.
Galaxy Digital founder Mike Novogratz sounded upbeat during the firm’s third-quarter earnings call on November 9 when he said that approval for ETFs “is now not a matter of if but when.” Novogratz believes 2024 will be a year of institutional adoption, triggered by the approvals of both the Bitcoin and Ether ETFs.
The news and events of the past few weeks have increased institutional participation. According to CoinShares Digital Asset Fund Flows Weekly Report, Digital asset investment products saw an inflow of $293 million last week. That took the total 7-week of inflows to more than $1 billion.
Will Bitcoin and major altcoins enter a short-term corrective phase or is the dip a buying opportunity? Let’s study the charts to find out.
BTC/USD Market Analysis
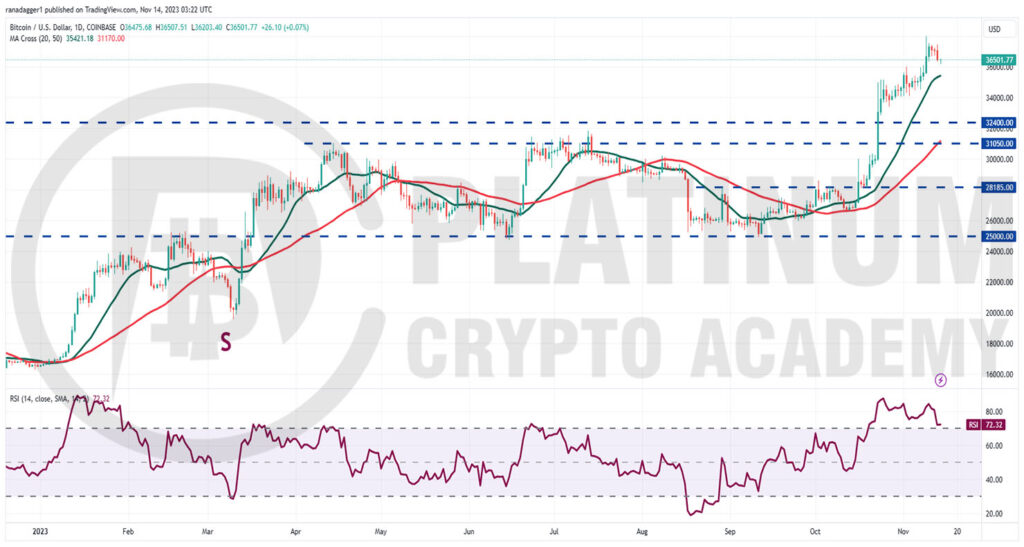
We said in the previous analysis that there was a possibility of resumption of the uptrend as the bulls were not giving up much ground. That happened on November 9 when Bitcoin soared to $37,999. However, the higher levels attracted profit-booking as seen from the long wick on the day’s candlestick.
The relative strength index (RSI) has been in the overbought zone for the past several days, indicating that a correction is possible. The first support on the downside is at the 20-day simple moving average (SMA).
If bulls want to maintain the momentum, they will have to defend this level with vigor. A strong rebound off this level will indicate that the bulls continue to buy on dips. That will increase the likelihood of a break above $37,999. The pair may then climb to the formidable resistance of $40,000.
Contrary to this assumption, if the price breaks below the 20-day SMA, it will indicate that the bulls are rushing to the exit. That could intensify the correction and pull the price to $33,440. The deeper the correction, the greater the time needed for the resumption of the uptrend.
ETH/USD Market Analysis
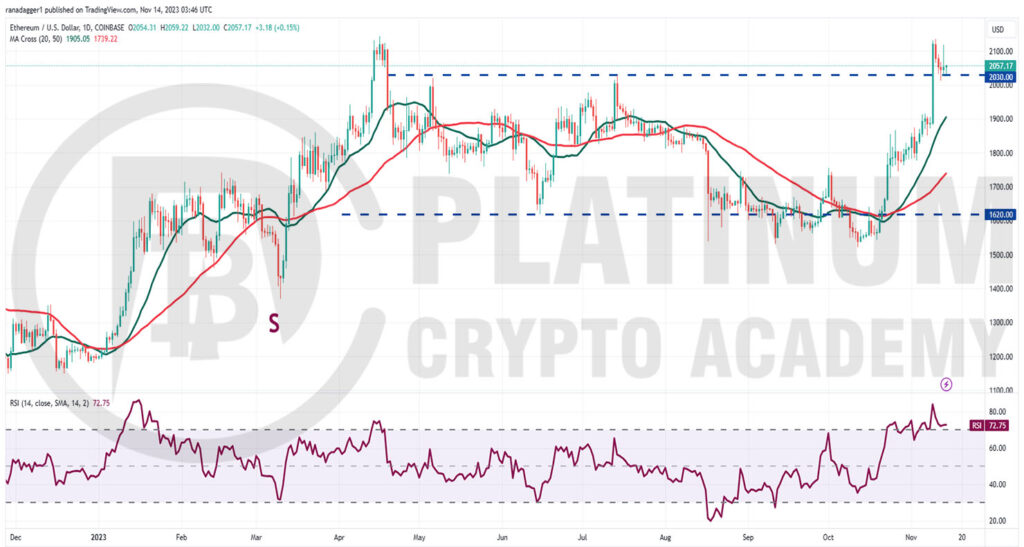
We highlighted the tight range-bound action in Ether and said that a break above $1,866 could push the price to $2,030. That happened on November 9 when the price shot past this level.
The sharp rally reached $2,136.53 on November 10 where profit-booking set in. But a positive sign is that the bulls are trying to stall the pullback at the breakout level of $2,030.
The bulls tried to start a rally on November 13 but the long wick on the candlestick shows that the bears are selling aggressively at higher levels. This could keep the ETH/USD pair stuck inside the tight range between $2,030 and $2,136.53 for some time.
The rising moving averages and the RSI in the overbought territory indicate that the path of least resistance is to the upside. If the price rises above $2,140, the pair could start the next leg of the uptrend to $2,950.
This bullish view will be invalidated in the near term if the price turns down and plummets below $2,030. That could sink the price to the 20-day SMA.
BNB/USD Market Analysis
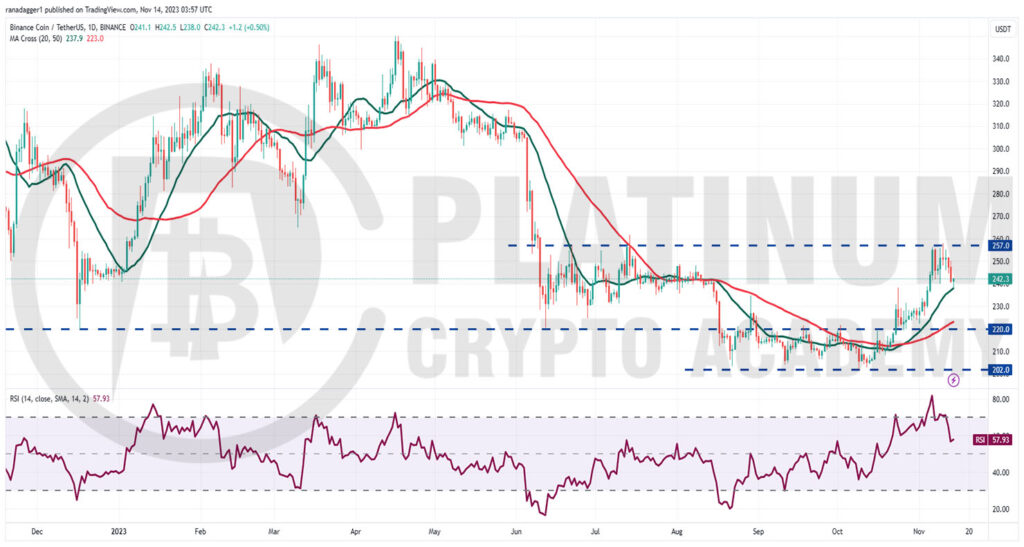
We projected a rally to $261 in the previous analysis and Binance Coin came very near to the level on November 10 when it hit $258. The bears are posing a strong challenge at the overhead resistance of $257.
That started a pullback which has reached the 20-day SMA. This is an important level to keep an eye on because a strong bounce off it will suggest a change in sentiment from selling on rallies to buying on dips.
That could improve the prospects of a rally above $257. If that happens, the BNB/USD pair could pick up momentum and surge toward $285 as there is no major resistance in between. If this level also gets taken out, the rally could skyrocket to $305.
On the downside, the bears will have to sink and sustain the price below the 20-day SMA to weaken the bulls. That could indicate a possible range-bound action between $220 and $257 for a while.
XRP/USD Market Analysis
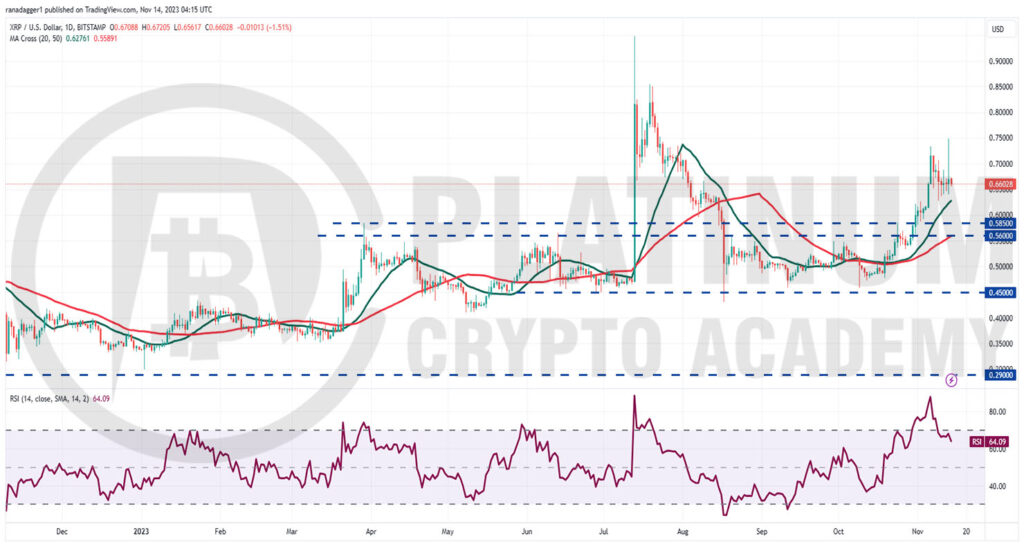
We mentioned in the previous analysis that the path of least resistance was to the upside and XRP could climb to $0.75. The XRP/USD pair came very close to this level on November 13 but the long wick on the candlestick shows aggressive profit booking by traders.
The bears will try to tug the price to the 20-day SMA. This level is likely to witness a tough battle between the bulls and the bears. If the price snaps back from the 20-day SMA, it will suggest that the bulls continue to view the dips as a buying opportunity.
The pair could then once again rise to $0.75. A break and close above this level will start the next leg of the up-move to $0.85.
Contrarily, if the price turns down and plunges below the 20-day SMA, it will suggest that the traders are rushing to the exit. That could pull the price down to the 50-day SMA.
ADA/USD Market Analysis
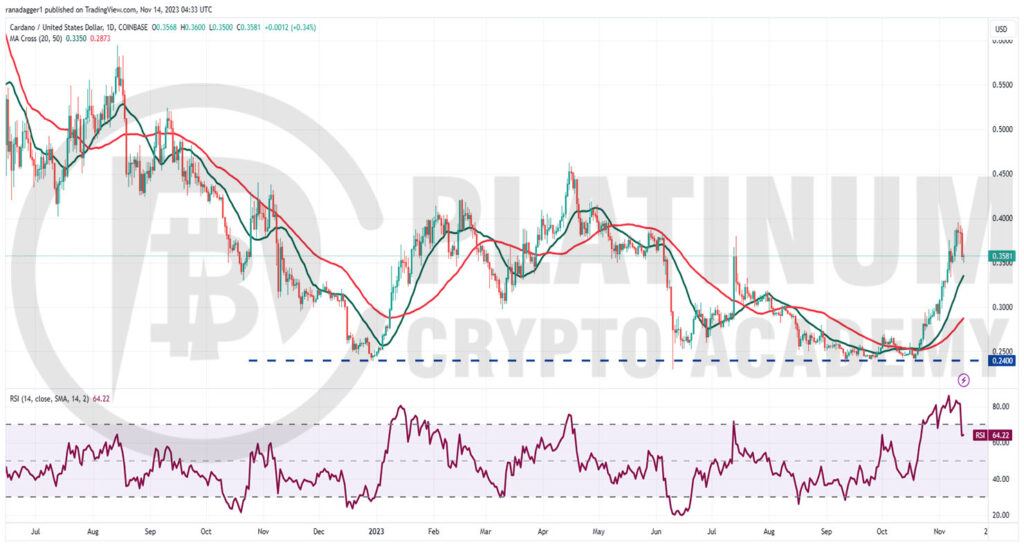
Both our projections in the previous analysis, a pullback to $0.28 and a rally to $0.38 turned out to be correct. Cardano dipped near $0.28 on November 1 and reached $0.38 on November 9.
The up-move is facing resistance near $0.40. The failure of the bulls to continue the uptrend may have tempted short-term traders to book profits. That has started a pullback to the 20-day SMA.
This remains the key level to watch out for. If the price rebounds off this level with strength, it will indicate strong buying on dips. The bulls will then make one more attempt to propel the price above $0.40.
If they succeed, the ADA/USD pair could resume the uptrend toward $0.46 where the bears may again mount a strong defense.
On the downside, a break below the 20-day SMA will indicate that the bulls are losing their grip. That could clear the path for a possible decline to the 50-day SMA.
Hopefully, you have enjoyed today’s article for further coverage please check out our crypto Blog Page. Thanks for reading! Have a fantastic day! Live from the Platinum Crypto Trading Floor.
Earnings Disclaimer: The information you’ll find in this article is for educational purpose only. We make no promise or guarantee of income or earnings. You have to do some work, use your best judgement and perform due diligence before using the information in this article. Your success is still up to you. Nothing in this article is intended to be professional, legal, financial and/or accounting advice. Always seek competent advice from professionals in these matters. If you break the city or other local laws, we will not be held liable for any damages you incur.
