
Hi Crypto Network,
Bitcoin ended the third quarter of the year on a negative note. Pullbacks are a part of every bull phase. CEO & chief investment officer of Morgan Creek Capital Management Mark Yusko compared Bitcoin to Amazon and said that the e-commerce giant has seen an average peak-to-trough of 31% and two of those corrections were 90% deep.
People who sold out during those declines lost out in the long-term. He believes that the current fall in Bitcoin should be viewed as a buying opportunity.
However, not everyone is bullish on Bitcoin. Billionaire technology investor Mark Cuban believes that Bitcoin does not have any intrinsic value and its price is determined by the market’s demand for it. He likened Bitcoin to artwork, comic books, and baseball cards.
An encouraging sign in this fall has been that a few altcoins have outperformed Bitcoin due to which, its dominance is down to 67.6%. This shows that at these beaten-down prices, the interest in altcoins is returning. Which of the top five cryptocurrencies is showing strength? Let’s find out.
BTC/USD
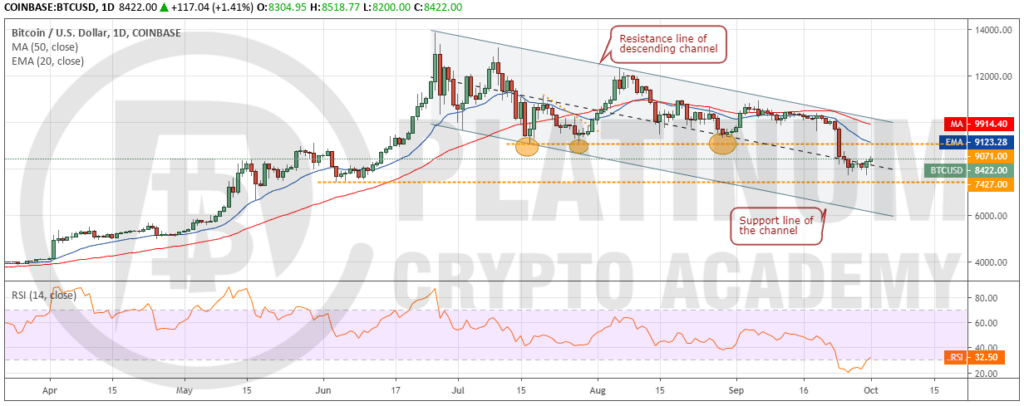
The bears plunged Bitcoin below $9,071 on September 24 and followed it up with further selling that dragged the price close to the next support of $7,427. We like the way the bulls bought the dips on September 26 and 30. This shows demand at lower levels. The price can now pullback to the breakdown level of $9,071, which is likely to act as a stiff resistance.
Both moving averages are sloping down and the RSI is close to oversold zone, which shows that bears are still in command. If the price turns around from $9,071, the bears will again attempt to sink the price below $7,427. A break below this level will be a huge negative and can drag the price to the support line of the channel at $6,000.
However, if the next dip to $7,471 is purchased, it will indicate a bottom and will offer a good buying opportunity. If the bears push the price above $9,071, it will indicate that the current dip was a bear trap. We will suggest a long position after the cryptocurrency breaks out of the descending channel or during the next bounce off $7,700.
ETH/USD
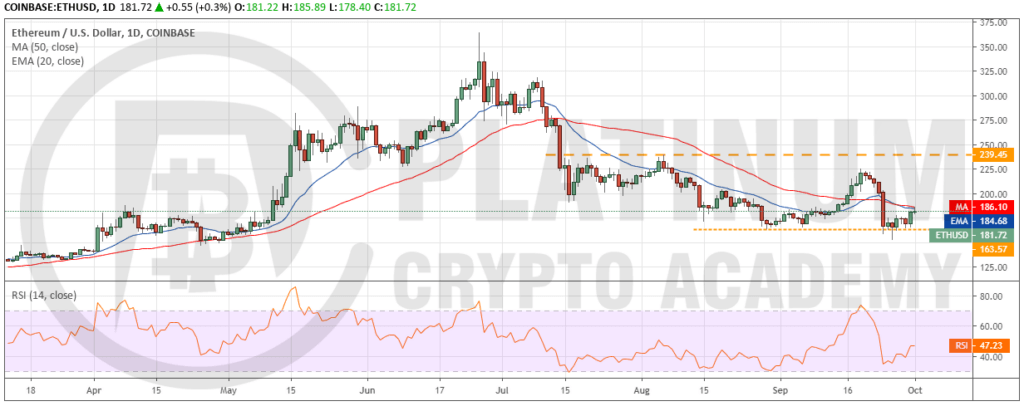
Ether plunged on September 24, which triggered our stop loss of $160 suggested in our previous analysis. However, the dip below $163.57, both on September 24 and 26, was short-lived as the price quickly bounced back above it. This is a positive sign as it shows strong demand at lower levels.
The pullback has reached the moving averages, which might act as a resistance. If the next dip towards $163.57 is purchased, we will suggest long positions in it once again. However, if the next dip breaks below $150, it can extend the decline to $122.
In the current pullback, if bulls push the price above the moving averages, a move to $239.45 will be on the cards. Both moving averages are flattening out and the RSI has risen to the midpoint, which suggests a balance between buyers and sellers.
XRP/USD
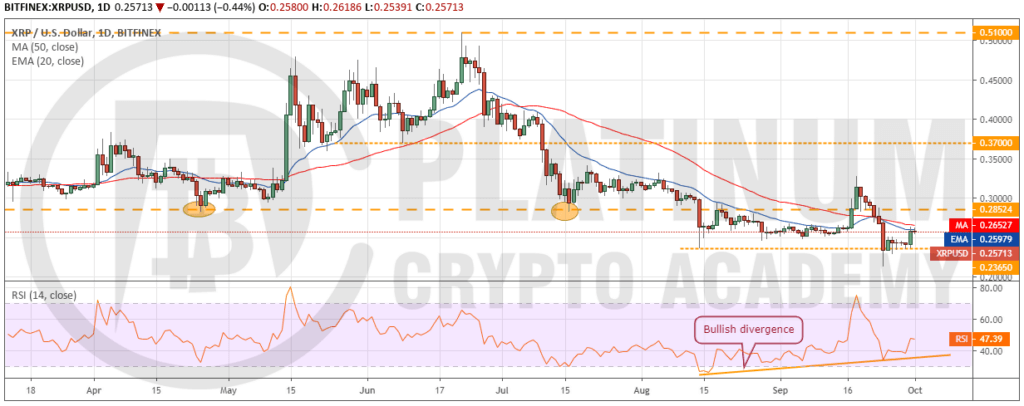
The sharp fall on September 24 triggered our stop loss suggested in the previous analysis. However, the dip was purchased aggressively and the price quickly recovered back above $0.23650. This is a positive sign, which shows that market participants did not panic in this breakdown but used the dips to buy.
After a few days of small range days, XRP moved up on September 30, which shows urgency among traders to buy. The bullish divergence on the RSI is also a positive sign. The pullback might face some resistance at the moving averages and above it at $0.28524.
If the next dip stalls above $0.23650, we will suggest long positions once again. The cryptocurrency will pick up momentum if it sustains above $0.28524.
BCH/USD
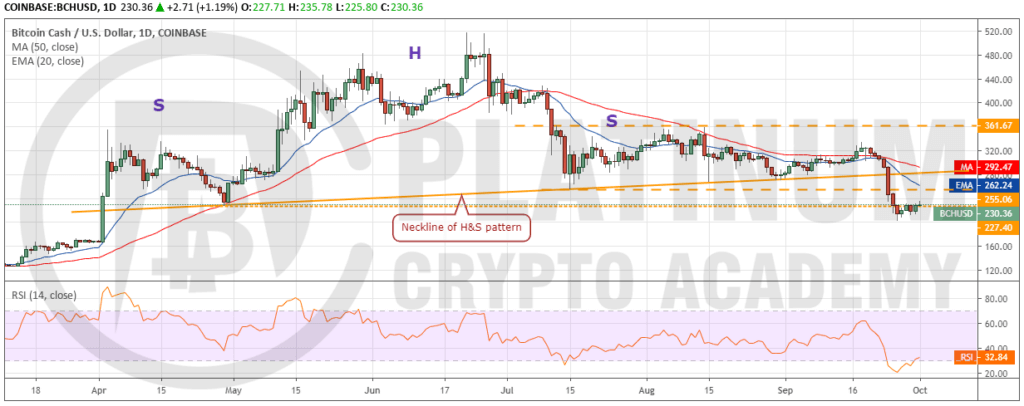
The head and shoulders pattern completed on September 24 as Bitcoin Cash broke below the neckline. Though the pattern target is way lower, a drop to $166.98 is possible. However, it is unlikely to be a straight dash to $166.98. The bulls are currently attempting a pullback, which can move up to the 20-day EMA.
Both moving averages are sloping down and the RSI is in the negative territory, which suggests that bears have the upper hand. If the price turns down from 20-day EMA, the bears will again attempt to resume the down move.
On the other hand, if the bulls can push the price above the neckline of the head and shoulders pattern, it will signal that the decline is over. We will wait for a new buy setup to form before proposing a trade in it.
LTC/USD
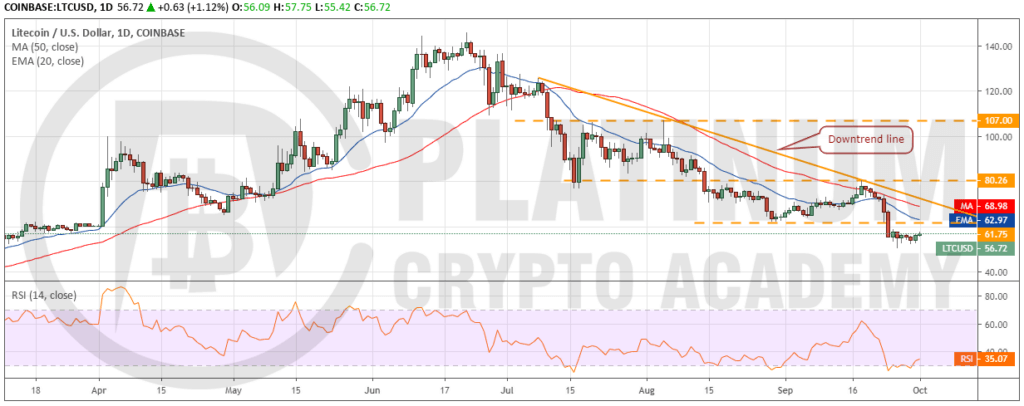
Litecoin broke below the critical support of $61.75 on September 24. That was followed by further selling that dragged prices to $50.25 on September 26. Currently, the bulls are attempting a pullback that is likely to face resistance at $61.75. Both moving averages are sloping down and the RSI is close to the oversold zone, which suggests that bears are in the driver’s seat.
If the cryptocurrency turns down from the 20-day EMA, the bears will again attempt to sink it below $50. If successful, the downtrend can extend to $40.
On the other hand, if the price rises above 20-day EMA, it can move up to 50-day SMA, which will act as a stiff resistance. If the bulls can sustain the price above 50-day SMA, a rally to $80.26 is possible, above which a new uptrend is likely. We will wait for a new buy setup to form before suggesting a trade in it.
Hopefully, you have enjoyed today’s article. Thanks for reading!
Have a fantastic day!
Live from the Platinum Crypto Trading Floor.
Earnings Disclaimer: The information you’ll find in this article is for educational purpose only. We make no promise or guarantee of income or earnings. You have to do some work, use your best judgement and perform due diligence before using the information in this article. Your success is still up to you. Nothing in this article is intended to be professional, legal, financial and/or accounting advice. Always seek competent advice from professionals in these matters. If you break the city or other local laws, we will not be held liable for any damages you incur.
