Hi Crypto Network,
Bakkt’s launch saw a timid response as only 71 contracts exchanged hands in the first 24 hours of its launch. Leading up to the launch of Bakkt, Bitcoin had been in a tight range. Its volatility has dropped to the lowest level since April 01 of this year.
This shows that the market participants are cautious and uncertain about the next direction of the trend, hence, they have been avoiding large positions. Under such circumstances, it natural for the institutional players to play it safe and establish positions only after a trending move starts.
Though Facebook’s Libra project has been facing numerous regulatory hurdles, the company is confident that it will be able to address those and launch in 2020. It recently disclosed that the Libra cryptocurrency will be backed by reserves of US dollar, euro, Japanese yen, British pound and Singapore dollar.
The markets will now look for a trigger that can start the next leg of the up move in cryptocurrencies. We don’t believe that an altseason will arrive without the support of Bitcoin. For altcoins to perform, Bitcoin should either lead the pack or at least be in a range. If Bitcoin slumps into a downtrend, most altcoins are likely to follow suit. What does the chart of the top five cryptocurrencies by market capitalization project? Let’s find out
BTC/USD
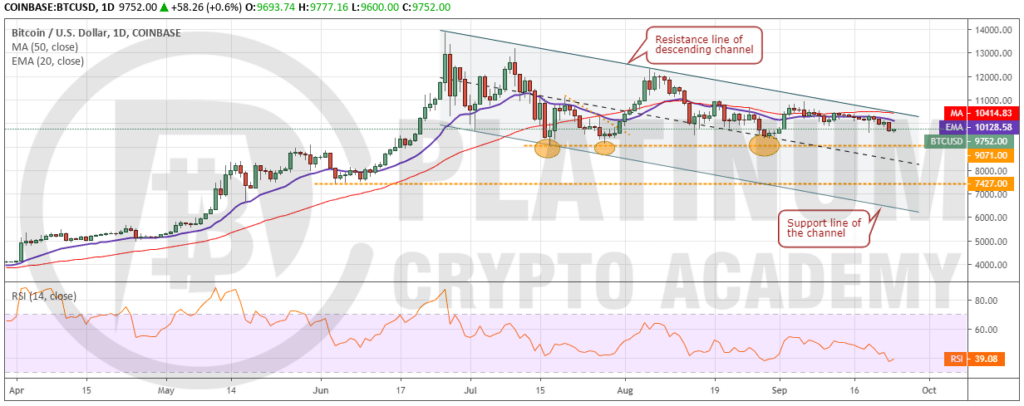
The tight range in Bitcoin is resolving to the downside, which is a negative sign. It has given up ground in the past three days and is approaching the critical support of $9,071. The 20-day EMA has started to turn down and the RSI has slipped into the negative territory. This suggests that bears have the upper hand in the short-term.
If Bitcoin breaks down and closes (UTC time) below $9,071, it will hurt sentiment. This can result in panic selling that can drag the price to $7,427, which is an important support. Below this level, a drop to the support of the channel at $6,000 is likely.
However, if the cryptocurrency bounces off the critical support of $9,071, we expect the bulls to again attempt to break above the resistance line of the channel. If successful, we anticipate buyers waiting on the sidelines to jump in. This can result in a quick rally to $13,868.44. Therefore, we retain the buy recommendation given in our previous analysis.
ETH/USD
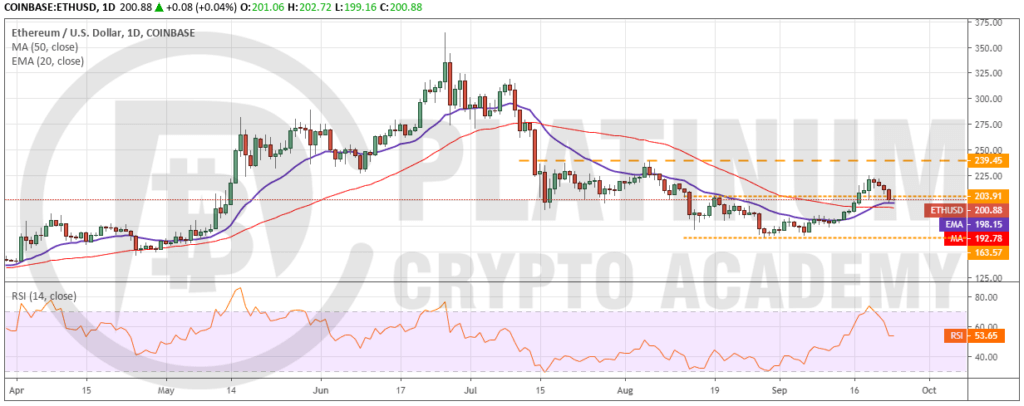
Ether broke out of the overhead resistance at $203.91 on September 17, which triggered our buy level recommended in the previous analysis. However, the up move could not even reach the first target of $239.45, which is a bearish sign. It shows a lack of demand at higher levels.
The price has pulled back to the moving averages, which is an important support. If the bulls defend this support, we anticipate another attempt to rally above $239.45. However, if the price slips below the moving averages, a drop to $163.57 is possible.
The 20-day EMA has flattened out and the RSI has dipped to just above 50 levels, which points to a range formation in the short-term. If $163.57 holds, the cryptocurrency might consolidate for a few more days. Nevertheless, if $163.57 cracks, the decline can extend to $150. Hence, traders can maintain the stop loss at $160.
XRP/USD
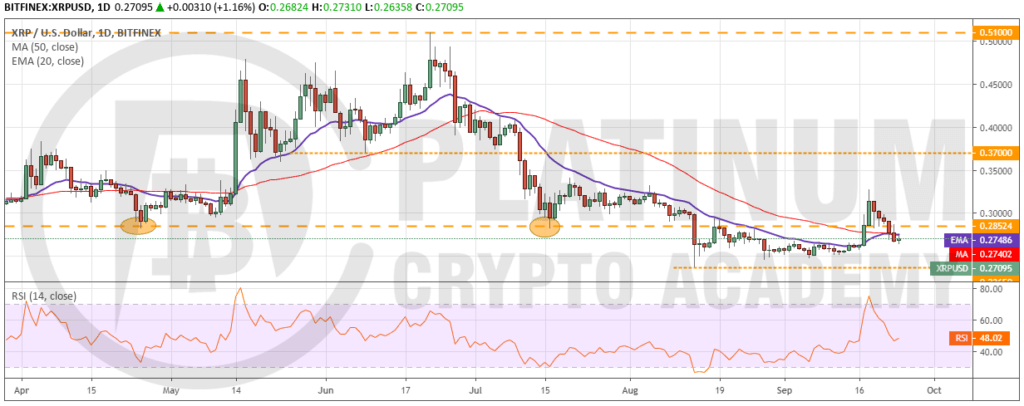
XRP surged on September 17 and closed (UTC time) above $0.28524, which triggered our buy recommended in an earlier analysis. However, contrary to our assumption, it could not rally to $0.37. It turned down from $0.32732 and gave up all its gains. This is a bearish sign as it shows a lack of buyers at higher levels.
Both moving averages have flattened out and the RSI is just below the midpoint, which suggests a range-bound action for the next few days. However, if the bears sink the cryptocurrency below $0.2365, it will turn negative and can plummet to new yearly lows. The next support on the downside is way lower at $0.18.
However, if the price turns around from current levels and breaks out of $0.28524, it will try to rise to $0.37. Therefore, traders can keep the stop loss on the long position at $0.23.
BCH/USD
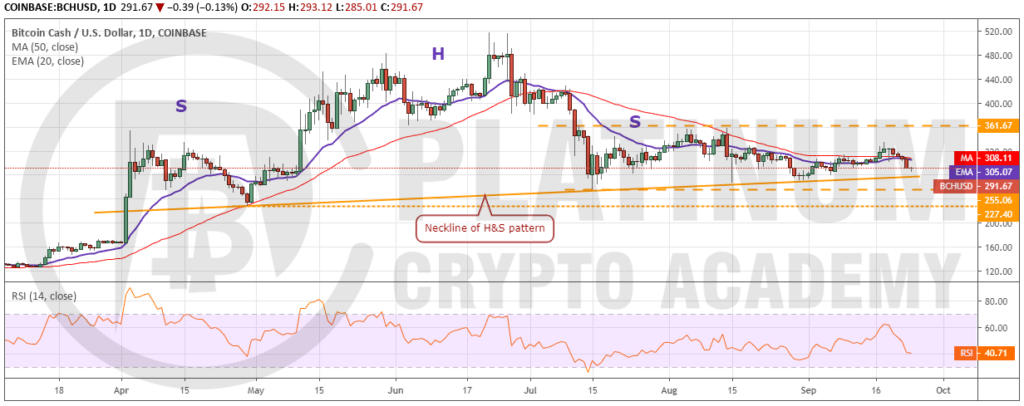
Bitcoin Cash has again slipped to the neckline of the head and shoulders pattern, which is an important support. If this support breaks down and the cryptocurrency drops below $227.4, it will be a huge negative. The next support on the downside is way lower at $166.98 and below it at $105.
However, if bulls defend the zone between the neckline and $227.4, the cryptocurrency might remain range-bound for a few more days. It will turn positive on a breakout and close (UTC time) above $361.67. Until then, we remain neutral on the cryptocurrency.
LTC/USD
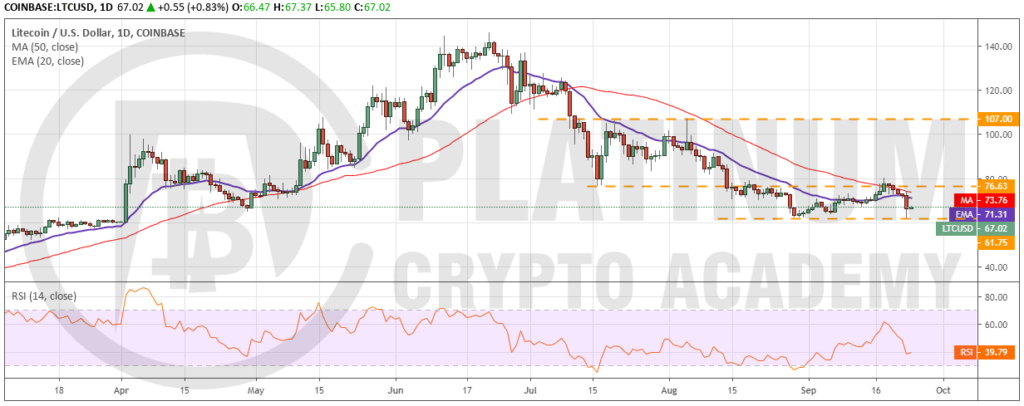
Litecoin broke above the 50-day SMA on September 18, which triggered our buy recommended in an earlier analysis. However, it proved to be a bull trap as it reversed direction from the next day and broke below the moving averages. The sharp dip on September 23 triggered our suggested stop loss of $62.
Both moving averages have turned down and the RSI has slipped back into the negative zone, which shows that bears are back in the driver’s seat. If the bears sink the cryptocurrency below $61.75, the downtrend will resume. The next support on the downside is way lower at $52. We will wait for the price to sustain above $76.63 for a couple of days before proposing a long position once again. Until then, we suggest traders remain on the sidelines.
Hopefully, you have enjoyed today’s article. Thanks for reading!
Have a fantastic day!
Live from the Platinum Crypto Trading Floor.
Earnings Disclaimer: The information you’ll find in this article is for educational purpose only. We make no promise or guarantee of income or earnings. You have to do some work, use your best judgement and perform due diligence before using the information in this article. Your success is still up to you. Nothing in this article is intended to be professional, legal, financial and/or accounting advice. Always seek competent advice from professionals in these matters. If you break the city or other local laws, we will not be held liable for any damages you incur.
