Hi Crypto Network,
The trade war between the world’s two largest economies, the US and China, is showing no signs of slowing down. This has increased the demand for safe haven assets. Bitcoin, along with gold, has emerged as the preferred choice and both have handsomely outperformed the S&P 500 in 2019.
Argentina has imposed capital controls, restricting dollar purchases and withdrawals. During earlier economic crises, the citizens were blocked from withdrawing their money from banks. To safeguard their wealth, this time, people are flocking to Bitcoin, which is not controlled by any authority. This has led to a premium in Argentine crypto exchanges over other exchanges.
During the run-up to the launch of CBOE futures in Dec. 2017, the market rallied hard but then sold off after the launch and entered a long bear phase. Will the launch of long-awaited Bakkt futures platform also result in a similar situation or will institutional players push prices higher?
The strong demand for Bitcoin has increased its dominance above 70% for the first time since March 2017. Is this a good time to buy Bitcoin or should traders buy altcoins, which have corrected a lot? Let’s analyse the charts and find out.
BTC/USD
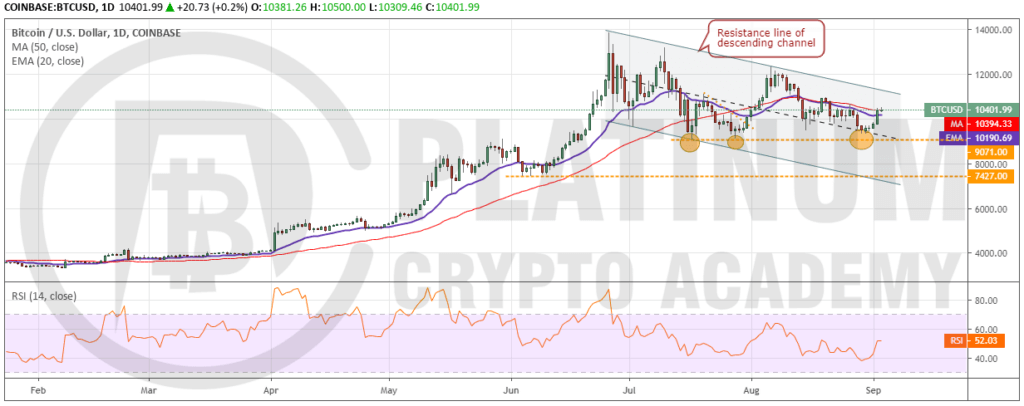
The decline to the strong support of $9,071 held for the third time since July 17. This shows that bulls are accumulating on dips to this support. The price is now likely to move up to the resistance line of the channel, where it might face some selling. Both moving averages are flat and RSI is just above the midpoint, which points to a consolidation in the short-term.
However, if bulls push the price above the channel, we anticipate the uptrend to resume. The first target will be a retest of yearly high at $13,868.44, above which the momentum is likely to pick up and a rally to $17,178 is probable. Therefore, traders can initiate long positions as suggested in our earlier analysis.
Our bullish view will be invalidated if the price fails to sustain above the moving averages or turns down from the resistance line of the channel. The trend will weaken on a breakdown of $9,071.
ETH/USD
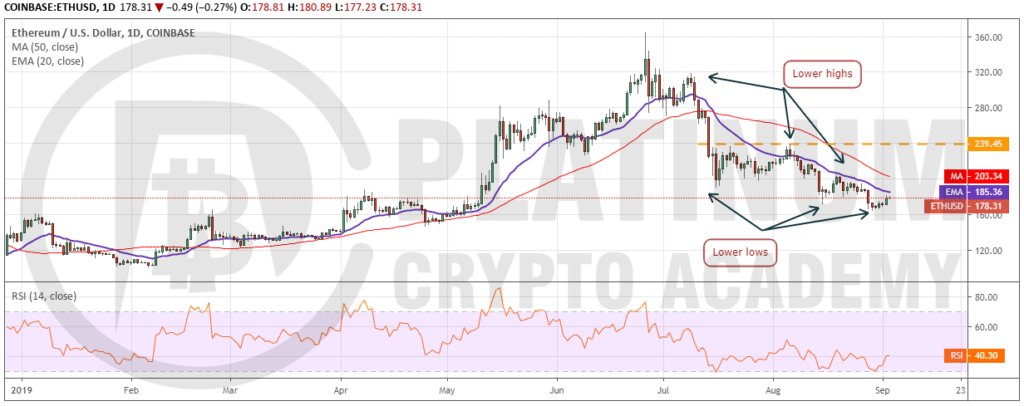
Ether is looking weak as it continues to make lower highs and lower lows. This shows that the sentiment is to sell on rallies to strong resistance level, rather than buy on dips to strong supports. The 20-day EMA has been acting as a strong resistance because recovery attempts have failed to sustain above it since July 10. Both moving averages are trending down and RSI is in the negative zone, which shows that bears have the upper hand.
A breakout of 20-day EMA will be the first indication that bears are losing their grip and a change in trend is plausible. The next resistance is 50-day SMA, above which, a rally to $239.45 is likely.
However, if the recovery turns down from 20-day EMA or from 50-day SMA, bears will again attempt to sink it below the recent low of $163.57. We do not find a trade set up with good risk to reward ratio, hence, we are not proposing a trade in it.
XRP/USD
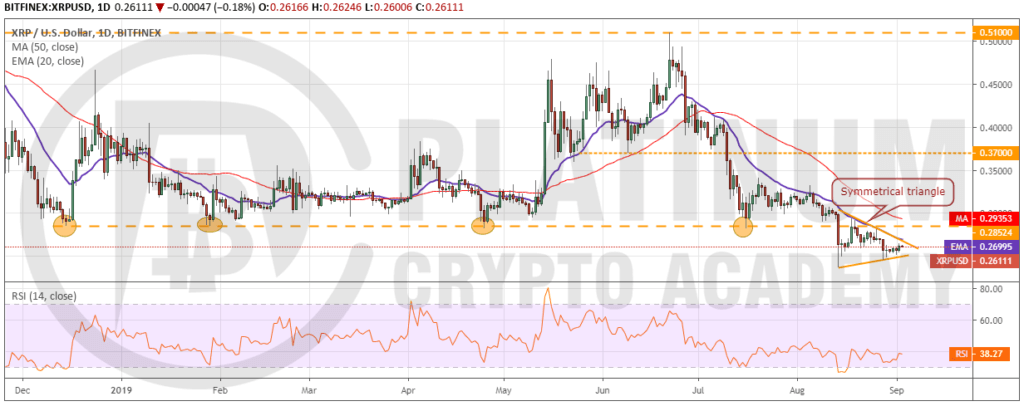
XRP continues to look weak as it trades close to the yearly lows. Failure to bounce strongly from close to the lows shows that bulls are not confident that the cryptocurrency has bottomed out. It has formed a symmetrical triangle, which usually works as a continuation pattern. If the price breaks down of the triangle, it will resume its downtrend and drop to the next support at $0.18. The downsloping moving averages and RSI in negative territory shows that bears have the upper hand.
Nevertheless, if bulls propel the price above the triangle, a relief rally is likely. If the price sustains above 50-day SMA, we expect the cryptocurrency to pick up momentum and rally to $0.37 and above it to $0.51. As the risk to reward ratio is attractive, we retain the buy suggestion given in our previous analysis.
BCH/USD
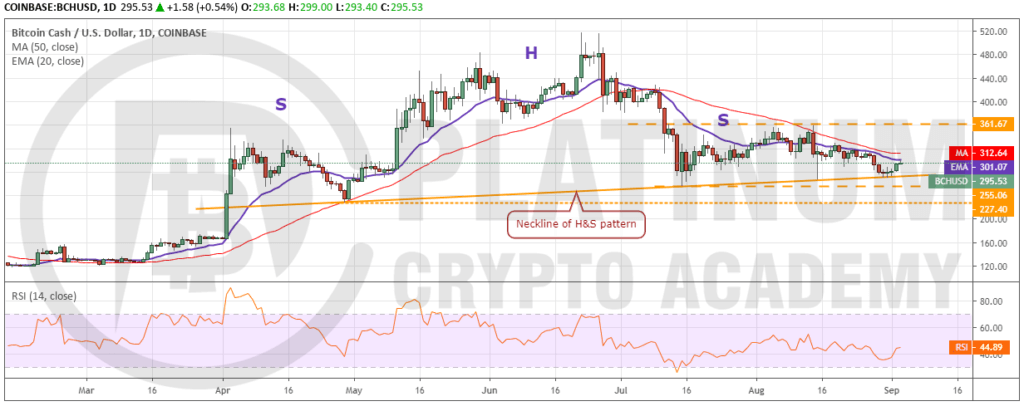
Bitcoin Cash again bounced off the neckline of the head and shoulders (H&S) pattern during the week, which is a positive sign. This shows that bulls are defending this critical level. However, unless the bulls push the price above the moving averages, the danger of a breakdown below the neckline remains high.
If the price closes (UTC time) below the neckline, the H&S pattern will complete, which can result in a quick drop to $166.98 and below it to $105.
However, if bulls propel the price above the moving averages, a rally to $361.67 is probable. If the momentum can carry the price above this level, a move to $432.94 and above it to $517.75 is likely. We will suggest a long position after the price breaks out and closes (UTC time) above $361.67.
LTC/USD
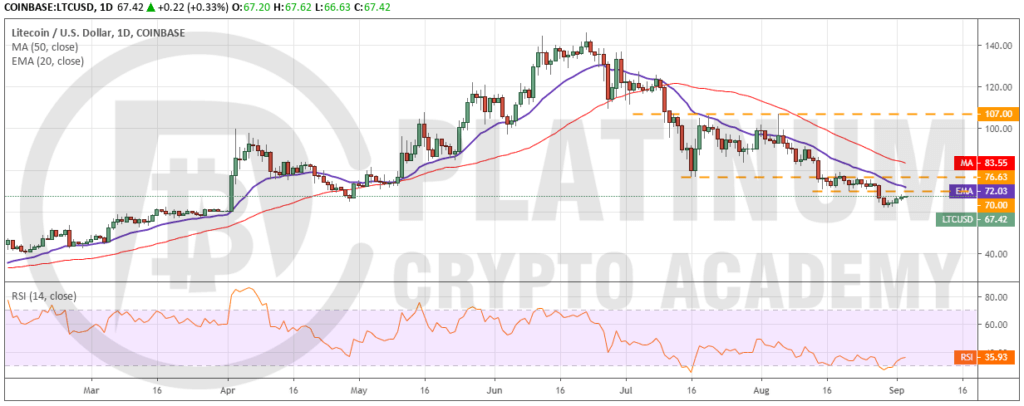
Litecoin is in a downtrend. The bears broke below the support at $70 on August 28, which shows a lack of buying even at strong support levels. Both moving averages are sloping down and RSI is close to oversold zone. This shows that bears have the upper hand and relief rallies will face selling at 20-day EMA and above it at 50-day SMA.
If the price turns down at 20-day EMA, bears will attempt to sink the cryptocurrency below $60. If this support breaks down, the fall can extend to $52 and below it to $42.
Conversely, if bulls push the price above both moving averages, it will indicate that the downtrend has ended. Above 50-day SMA, a move to $107 is possible. However, as supports are not holding, we withdraw the buy recommendation given in our previous analysis. We will wait for a reversal pattern to form before suggesting a long position in it once again.
If you’ve booked your session above, we look forward to speaking to you soon!
Hopefully, you have enjoyed today’s article. Thanks for reading!
Have a fantastic day!
Live from the Platinum Crypto Trading Floor.
