
Hi Crypto Network,
Along with all the bullish news in the crypto space, the markets will keep a close eye on the forthcoming launch of Facebook’s own cryptocurrency later in the month. The expectations are high that Facebook’s entry into this space will prove to be bullish.
However, if the details on the project disappoint, it might usher in a bout of profit booking in most major cryptocurrencies. We believe this will offer a low-risk entry point to the traders.
With Bitcoin having put a bottom in place, traditional finance companies are once again looking at offering various crypto related services. Rumours suggest that E*Trade is likely to launch cryptocurrency trading for its clients. With $346 billion of its client’s assets under management, the entry of E*Trade is likely to be bullish for the crypto space.
As the sentiment improves, analysts are again projecting lofty targets on Bitcoin. We believe that a repeat of the rally seen in 2017 is unlikely. The current rally will be a measured move with intermittent dips. Traders can use these dips to enter long positions instead of chasing prices higher.
BTC/USD
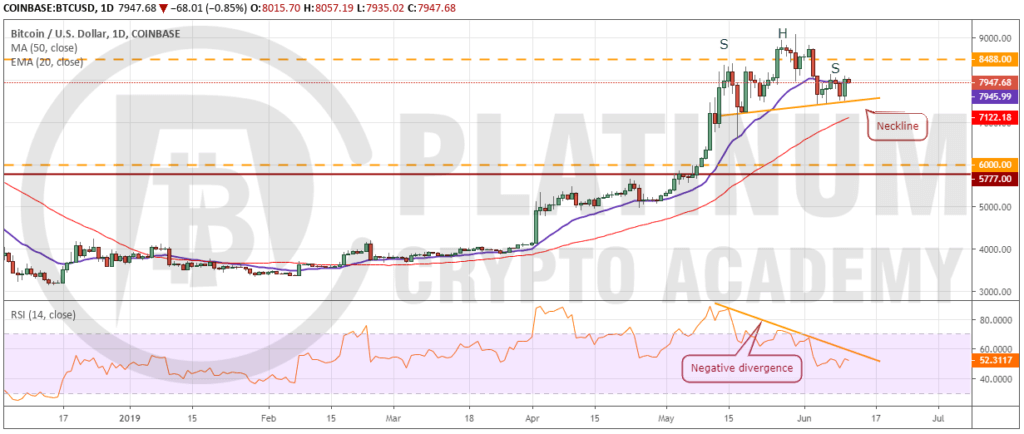
Bitcoin is forming a head and shoulders (H&S) pattern that will complete on a breakdown and close (UTC time) below the neckline. This gives it a target objective of $5,620. However, a H&S pattern with an upsloping neckline is less reliable than the one with a down sloping neckline. Additionally, the cryptocurrency has strong support at the 50-day SMA and below it at $5,777. We anticipate buyers to step in this zone.
On the contrary, if the bulls defend the neckline and push the price above $8,150, a rally to $8,488 followed by a move to $9,090 will be on the cards. A breakout of $9,090 will invalidate the bearish pattern and can result in a rally to $10,000.
Currently, the 20-day EMA has flattened out and the RSI is close to 50 levels. This points to a range formation in the near term. After the sharp rally from the lows, a few days of consolidation or a minor correction is to be expected. Until the price stays above $6,000-$5,777 support zone, we remain bullish on the cryptocurrency. We shall wait for the correction to end before suggesting a trade in it.
ETH/USD
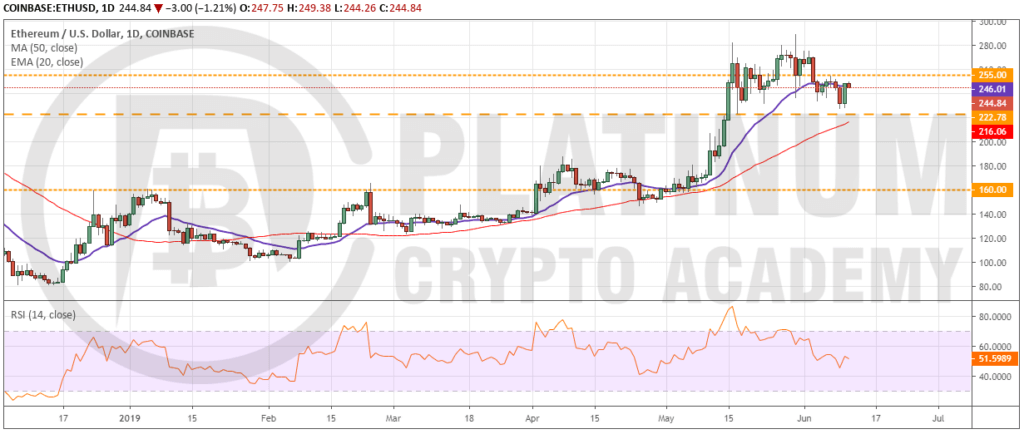
Ethereum is currently range bound between $222.78 and $280. The 20-day EMA is flat and the RSI is close to the midpoint. This suggests that the range bound action might continue for a few more days.
A breakout of $280 will be the first sign that the bulls are back in command. Longer the consolidation, stronger will be the eventual breakout.
If, however, the bears sink the digital currency below $222.78, there is minor support at the 50-day SMA. If this support cracks, a quick drop to $160 is probable.
Trading inside the range can be volatile. Therefore, traders can wait for the price to fall closer to the bottom of the range before buying. Similarly, profits should be booked near the resistance of the range. Currently, we do not find any buy setup with a good risk to reward ratio.
XRP/USD
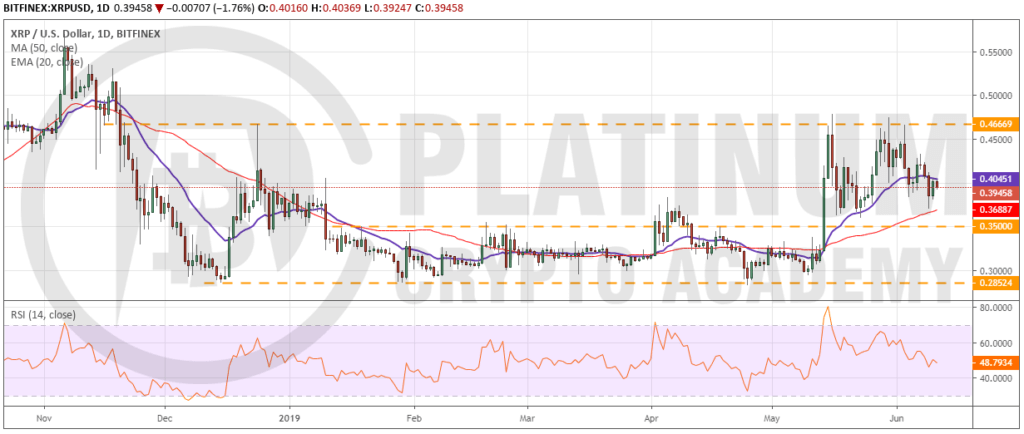
XRP is currently range-bound between $0.36 and $0.46669. The 20-day EMA is flat and the RSI is just below the midpoint. This suggests the range-bound action will continue for a few more days. Though the price has bounced off the 50-day SMA, it is struggling to scale above the 20-day EMA. This shows a lack of demand at higher levels.
If the price does not rise above the 20-day EMA within the next couple of days, the bears will attempt to sink the cryptocurrency below the 50-day SMA and the horizontal support at $0.350.
On the other hand, if the price breaks out of the 20-day EMA, we expect the bulls to attempt a breakout of $0.46669 once again. Traders can watch the price action near $0.46669 and book profits on 50% of the long position if the price starts to turn down from the overhead resistance.
LTC/USD
The bulls failed to propel Bitcoin Cash above the ascending channel on May 30. The price turned down sharply and plummeted to the 20-day EMA. The subsequent attempt to bounce off the 20-day EMA did not find buyers at higher levels and the bears finally broke below the support on June 03. If the price sustains below the 20-day EMA, the next stop is the 50-day SMA and if that also cracks, a revisit to the support line of the channel is likely.
Our short-term bearish view will be invalidated if the digital currency reverses direction from the current levels and ascends the resistance line of the channel. In such a case, a rally to $638.55 is probable. However, we give this a very low probability of occurring. We shall wait for the correction to end before suggesting a trade in it.
BCH/USD
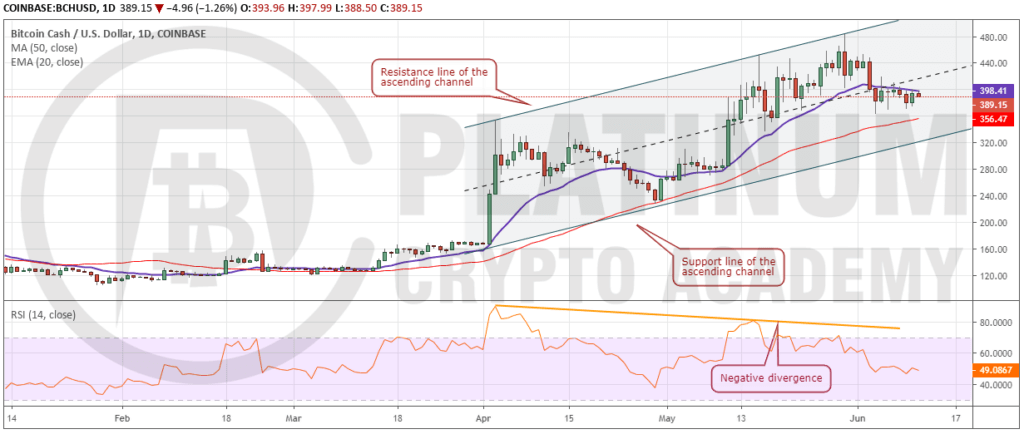
The bulls have failed to propel Bitcoin Cash above the 20-day EMA in the past seven days. This shows a lack of demand at higher levels. The 20-day EMA has flattened out and the RSI is just below 50 levels. This shows a balance between buyers and sellers.
If the bears sink the price below the 50-day SMA and the support line of the channel, the advantage will tilt in favour of the bears. On the other hand, if the bulls push the price above the 20-day EMA, a move to $440 and above it to the resistance line of the channel is probable.
We might suggest long positions if the bulls defend the support line of the ascending channel. Until then, we remain neutral on the cryptocurrency.
If you’ve booked your session above, we look forward to speaking to you soon!
Hopefully, you have enjoyed today’s article. Thanks for reading!
Have a fantastic day!
Live from the Platinum Crypto Trading Floor.
Earnings Disclaimer: The information you’ll find in this article is for educational purpose only. We make no promise or guarantee of income or earnings. You have to do some work, use your best judgement and perform due diligence before using the information in this article. Your success is still up to you. Nothing in this article is intended to be professional, legal, financial and/or accounting advice. Always seek competent advice from professionals in these matters. If you break the city or other local laws, we will not be held liable for any damages you incur.
")