
Bitcoin has been on a tear, rising eight weeks in a row. This shows that the bulls are firmly in the driver’s seat but suggests that the rally may be getting overextended in the near term. That could be one of the reasons for the sharp fall in Bitcoin and altcoins on December 11. The fall resulted in crypto liquidations of more than $500 million.
Although leveraged traders get burnt during sharp declines, it does not necessarily signal a trend change. A correction in an uptrend is considered a healthy sign as it reduces the excess speculation and shakes out the weaker hands. It also provides an opportunity for long-term investors to add to their positions at lower levels.
However, in the short term, institutional investors seem to be getting cautious after Bitcoin’s incessant rally over the past eight weeks. The CoinShares Digital Asset Fund Flows Weekly Report released on December 11 shows that inflows into digital investment products slowed down to $43 million last week. Notably, short positions inflows increased, signaling that investors expect a near-term correction.
The fall is unlikely to deepen further as investors are positive about Bitcoin’s prospects in 2024. Asset manager VanEck made 15 crypto predictions for 2024, including price forecasts, indicating that a bull phase is around the corner. The firm expects $2.4 billion of inflows into Bitcoin exchange-traded funds in the first quarter of 2024. It also projects Bitcoin to make a new all-time high in the fourth quarter of 2024.
The action is not limited to Bitcoin alone. Several altcoins have started to break out of their long-term downtrends, indicating a potential trend change. Many analysts believe that after Bitcoin’s sharp rally, it is time for altcoins to shine again.
Will Bitcoin and major altcoins find buying support at lower levels or will the correction deepen? Let’s study the charts to find out.
BTC/USD Market Analysis
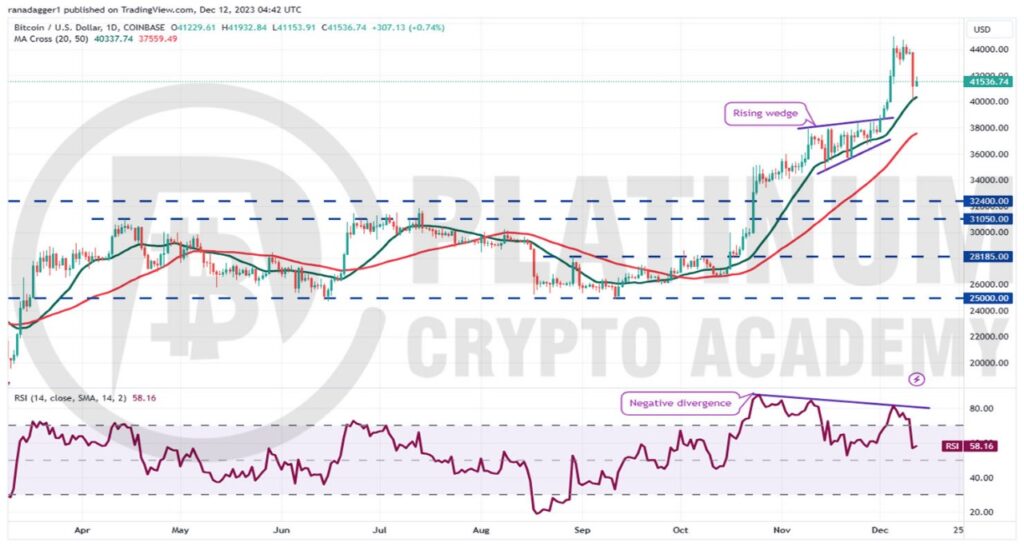
Bitcoin soared above the rising wedge pattern on December 2, invalidating the bearish setup. The failure of a negative setup is a positive sign as it attracts buyers. That started a sharp rally, which reached $45,000 on December 5.
After a tight consolidation near the 52-week high, the BTC/USD pair broke down on December 11, indicating that the traders were rushing to the exit. That pulled the price down to the 20-day simple moving average (SMA).
In an uptrend, traders generally buy the dips to the 20-day SMA. Hence, it is an important level to keep an eye on. If the price turns up from the current level, the bulls will again try to clear the overhead hurdle at $45,000. If they do that, the pair may surge to $48,000 and then to the psychological level of $50,000.
However, the negative divergence on the relative strength index (RSI) suggests that the bullish momentum is slowing down. This signals that the pair may spend some time inside a range or witness a deeper correction in the near term.
The selling could pick up momentum if the price skids below the 20-day SMA. That could open the doors for a fall to the 50-day SMA. This level is again likely to witness solid buying by the bulls.
ETH/USD Market Analysis
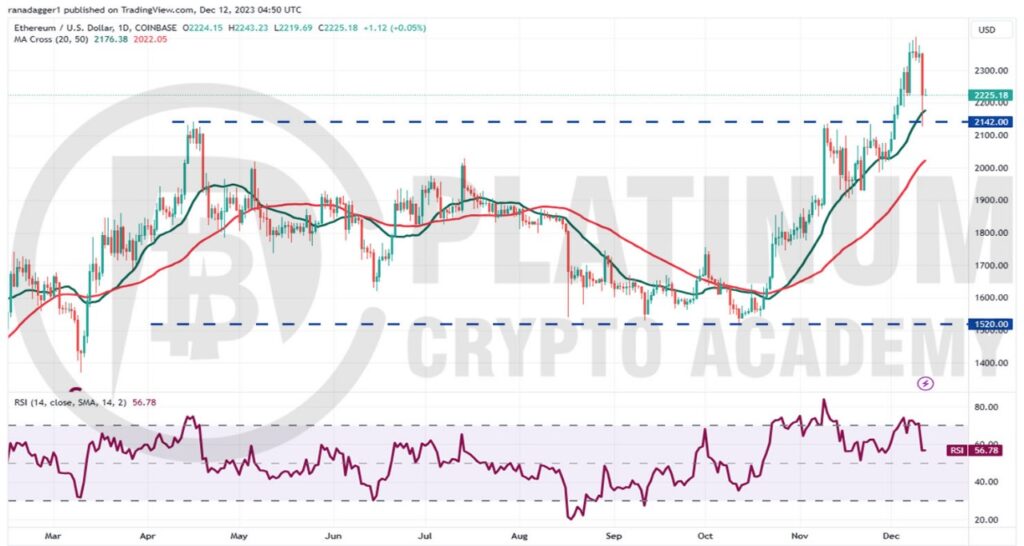
We expected Ether to remain range-bound between $2,142 and $1,520, but the bulls had other plans. They propelled the price above $2,142 on December 2, indicating the start of a new uptrend.
Generally, after breaking out from a significant resistance, the price turns down and retests the level. The ETH/USD pair turned down from $2,403 on December 9 and fell to $2,142 on December 11.
The $2,142 level is likely to witness a tough battle between the bulls and the bears. If the price rebounds off the level, it will suggest that buyers have flipped $2,142 into support. That will increase the likelihood of a rally to $2,516 and then to $2,950.
Contrarily, if the price breaks below $2,142, it will trap several aggressive bulls. That may first pull the pair down to the 50-day SMA and later to $1,900.
BNB/USD Market Analysis
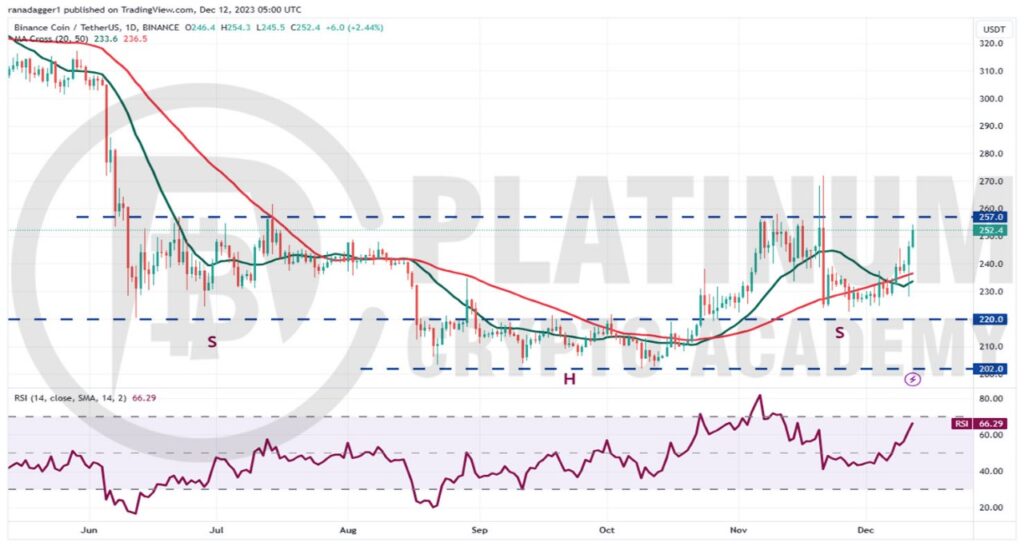
Binance Coin has been range-bound between $220 and $257 for the past few days. The bears tried to sink the price below $220 but the bulls held their ground, indicating solid demand at lower levels.
The BNB/USD pair picked up momentum after bulls pushed the price above the moving averages on December 8. The price has reached the overhead resistance of $257, which is an important level for the bears to defend.
If the sellers fail in their endeavor, the pair will complete an inverse head-and-shoulders pattern. This bullish setup will indicate the start of a new uptrend and has a target objective of $312.
Instead, if the price turns down sharply from $257, it will signal that the bears are defending the level with vigor. The pair could then extend its stay inside the range for a few more days.
XRP/USD Market Analysis
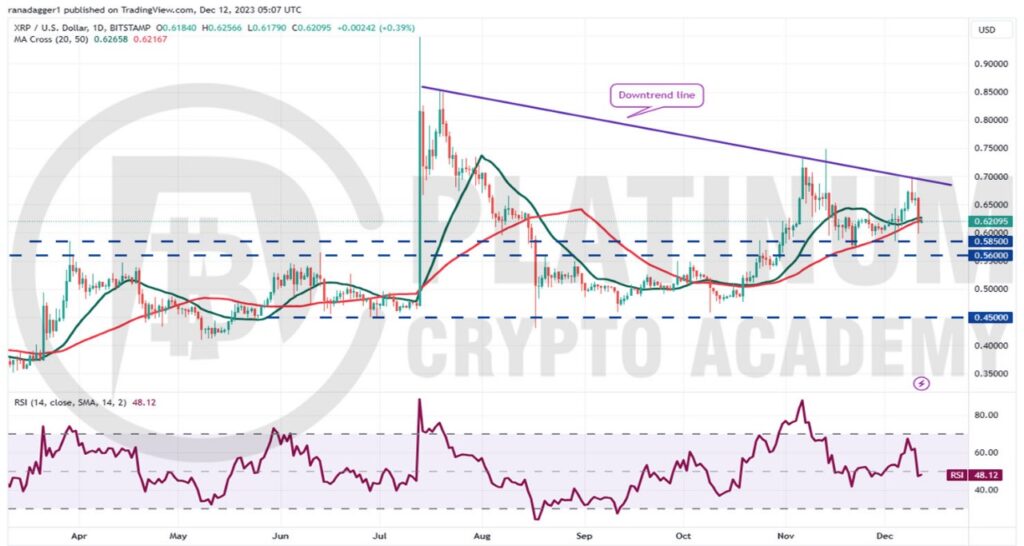
The bulls tried to start a rally in XRP but the bears successfully defended the downtrend line on December 9. This suggests that bears remain active at higher levels.
The sellers are trying to strengthen their position further by pulling the price below the moving averages. If they manage to do that, the XRP/USD pair could drop to the $0.58 to $0.56 support zone.
The bulls are expected to defend this zone with all their might because a failure to do so may accelerate selling. The pair could then plummet to the strong support at $0.45.
If bulls want to make a comeback, they will have to quickly push the price above the downtrend line. That could clear the path for a rally to $0.75 and then to $0.85.
ADA/USD Market Analysis
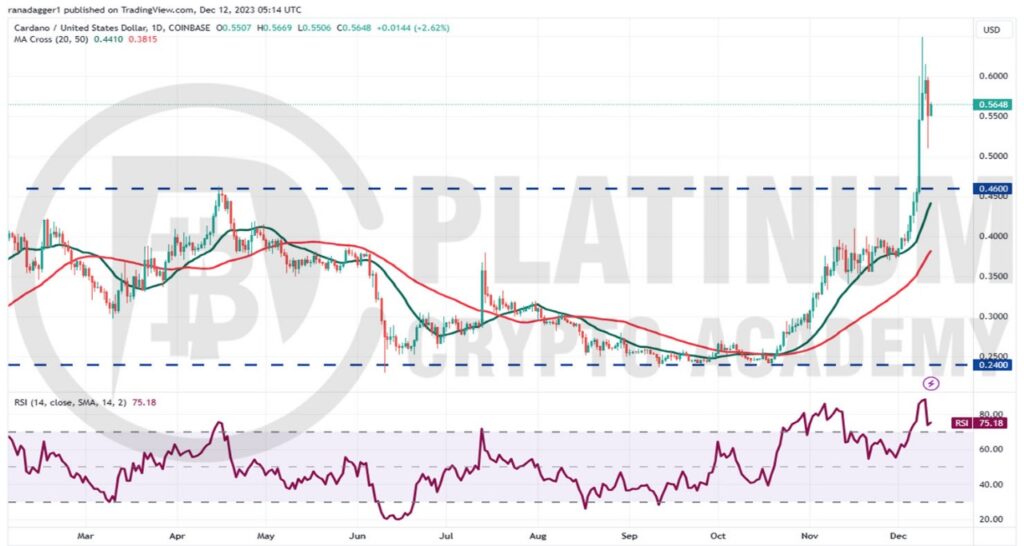
Cardano picked up momentum after breaking out of the overhead resistance at $0.46 on December 8. The ADA/USD pair quickly traveled to $0.65 on December 9, signaling FOMO among traders.
The up-move of the past few days pushed the RSI deep into the overbought territory, suggesting that the rally is overheated in the near term. That usually results in a correction or consolidation.
The failure to sustain the price above $0.60 may have tempted short-term traders to book profits on December 11. However, a positive sign is that the bulls purchased the dip near $0.50 as seen from the long tail on the day’s candlestick.
After the sharp rally of the past few days, the pair may enter a consolidation phase. The pair could oscillate between $0.50 and $0.65 for a while.
The uptrend may resume if bulls drive the price above $0.65. The pair may then soar to its next target objective of $0.79.
Hopefully, you have enjoyed today’s article for further coverage please check out our crypto Blog Page. Thanks for reading! Have a fantastic day! Live from the Platinum Crypto Trading Floor.
Earnings Disclaimer: The information you’ll find in this article is for educational purpose only. We make no promise or guarantee of income or earnings. You have to do some work, use your best judgement and perform due diligence before using the information in this article. Your success is still up to you. Nothing in this article is intended to be professional, legal, financial and/or accounting advice. Always seek competent advice from professionals in these matters. If you break the city or other local laws, we will not be held liable for any damages you incur.
