
Hi Crypto Network,
On March 9, crude oil had one of its worst falls since the gulf crisis and the equity markets witnessed the worst drubbing since the financial crisis. This shows that the traders are gripped by fear and are resorting to panic selling.
Investors have been buying bonds, which has pushed the yields to record lows. Gold has been holding up well and has not succumbed to selling, which cements its billing as a safe haven.
However, the same cannot be said about Bitcoin, which has failed to attract investors during the fall in the oil and equity markets. This shows that traders are treating Bitcoin as a risky asset and not as a safe haven. We believe that cryptocurrencies are a new asset class and the current crisis is the first one being faced by the crypto traders; hence, it is difficult to predict how they would react. However, an interesting thing is that even after the fall, Bitcoin is up year-to-date, similar to gold.
While the short-term gyrations affect the traders, the investors should look at the long-term picture and ride the volatility. More than 42% of Bitcoin supply has not moved since 2018, which shows that the long-term investors are holding on to their positions as they expect higher levels in the future.
PlanB, the creator of the popular stock-to-flow Bitcoin price model believes that Bitcoin will “probably go over $100k before Dec 2021.” Analyst Willy Woo also has a target of “around the $100,000 to $250,000 range depending on how long this bull market runs.” Max Keiser of The Keiser Report also has a target of “$100,000 and beyond.”
While these target objectives look attractive, as retail traders have limited capital, we would want to make the best use of every penny.
BTC/USD
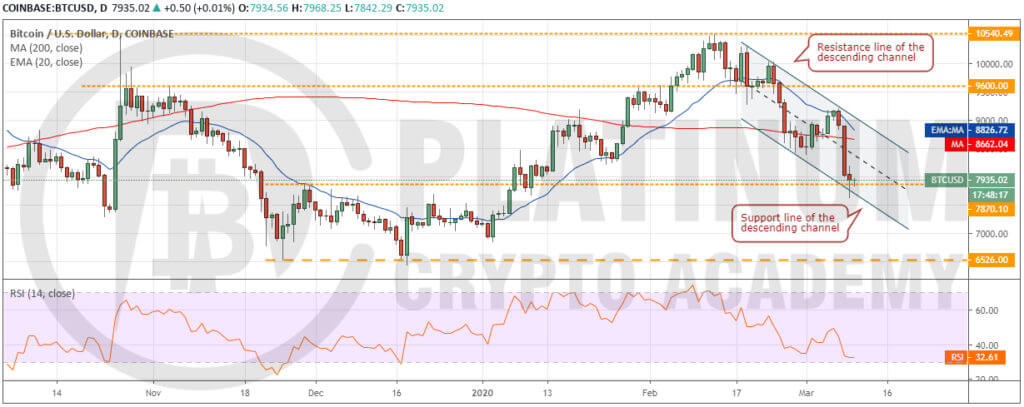
As suggested in our previous analysis, the bulls could not propel Bitcoin above the 20-day EMA. This attracted selling and the leading cryptocurrency turned down on March 7. The selling intensified on March 8 after the 200-day SMA and the support at $8,400 cracked.
Though the price broke below the critical support at $7.870.10 on March 9, the bears could not capitalize on the move and extend the decline. This shows some buying near the support line of the descending channel.
However, unless the price bounces off sharply from $7,870.10, the bears will make another attempt to sink the cryptocurrency below the channel. If successful, a drop to $7,000 and below it to $6,526 is possible.
The 20-day EMA is sloping down and the RSI is close to the oversold zone, which suggests that bears have the upper hand. Our bearish view will be invalidated if the price reverses direction from the current level and breaks above the resistance line of the channel. Until then, we suggest traders remain on the sidelines.
ETH/USD
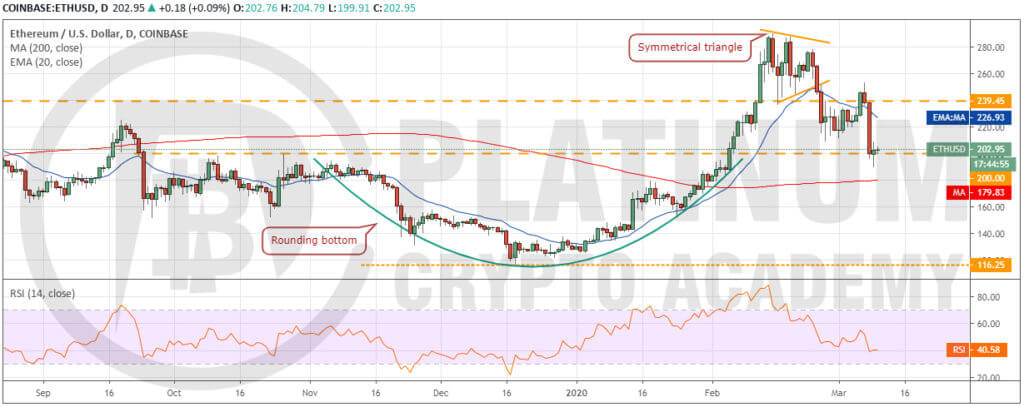
Ether broke above $239.45 on March 6 but this proved to be a bull trap because the price reversed direction on March 7 from $253.01. That was followed by huge selling on March 8 when the price plunged below $200.
The bears again attempted to extend the decline below $200 on March 9 but buyers stepped in at $189.85 and propped the price back above $200. This shows demand at lower levels. However, unless the bulls achieve a strong bounce off $200, the bears will once again try to drag the price lower.
If successful, the next support to watch on the downside is the 200-day SMA. Below this level, the decline can extend to $160.
Contrary to our assumption, if the bulls can defend the $200 level, the biggest altcoin can rise to $239.45 and remain range-bound between these two levels for the next few days.
XRP/USD
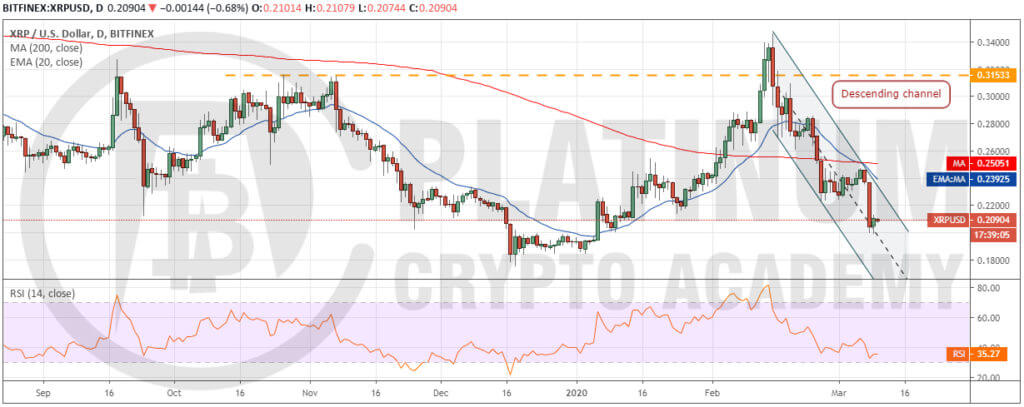
XRP reversed direction from the 20-day EMA on March 7, which is a negative sign as it shows that bears are selling aggressively at resistance levels. The fall on March 8 broke below the recent low of $0.22.
Currently, the bulls are trying to defend the psychological support at $0.20. However, unless the price rebounds sharply and breaks out of the descending channel, we anticipate the bears to make another attempt to sink the price to $0.176. The downsloping 20-day EMA and the RSI close to oversold levels indicate that bears have the upper hand.
The first sign of strength will be a move above the channel and the altcoin is likely to pick up momentum after it scales and sustains above the 200-day SMA. Until then, we suggest traders remain on the sidelines.
BCH/USD
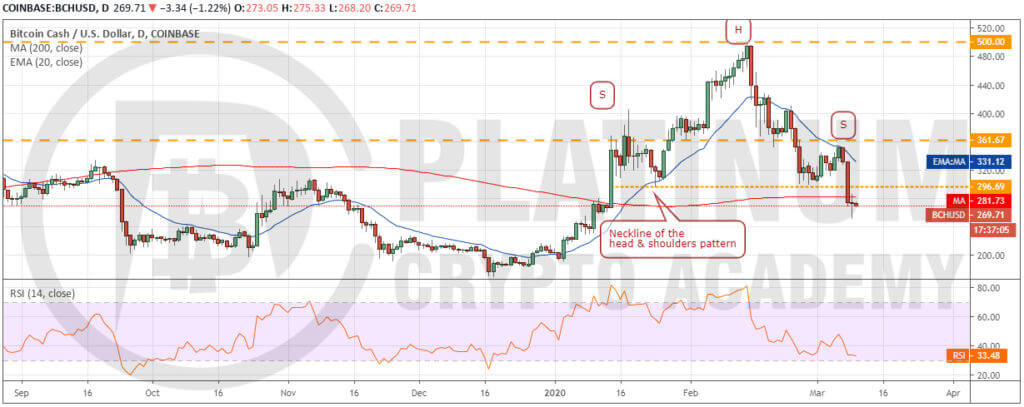
The bears have been aggressively defending the 20-day EMA for the past few days. This is a negative sign. The fall on March 8 completed the head and shoulders (H&S) pattern as the price closed (UTC time) below the neckline of the bearish setup.
For the past two days, the price has been trading below the 200-day SMA, which shows a lack of urgency among the buyers to buy even at these levels. Unless the bulls can push the price back above the 200-day SMA and the neckline of the H&S pattern, the downtrend will resume.
Though the target objective of the H&S pattern is way lower, we believe the buyers to provide some support at $200. As the altcoin has broken down after forming a bearish setup, we suggest traders wait for a new buy setup to form before initiating long positions.
BSV/USD
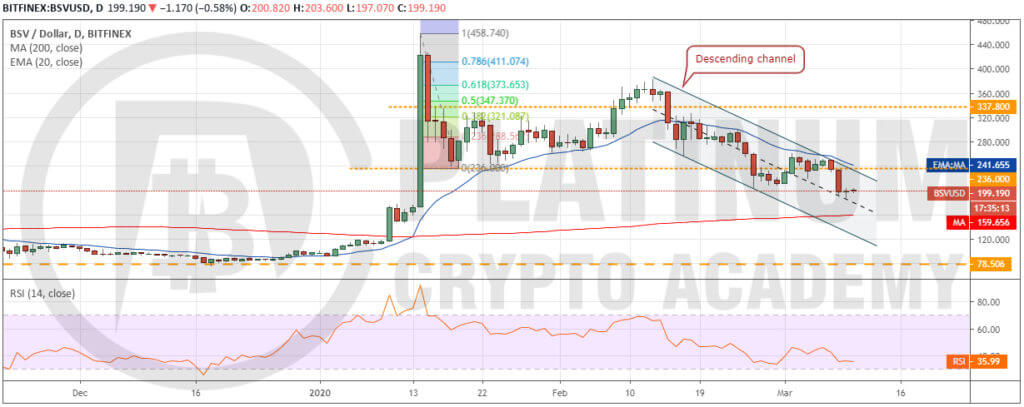
The bulls could not break above the 20-day EMA from March 2-7, which attracted sellers. Bitcoin SV broke below the support at $204.310 on March 8, which is a negative sign. This shows a lack of buying interest from the bulls. The 20-day EMA is sloping down and the RSI is close to the oversold zone, which suggests that bears have the upper hand.
The next support on the downside is the 200-day SMA at $160. We expect the bulls to defend this level aggressively. The critical level to watch on the upside is $236. A break above this level will signal accumulation by stronger hands at lower levels.
Therefore, we might suggest long positions after the price sustains above $236 for three days. Conversely, if the bulls fail to defend the 200-day EMA, the altcoin can plummet to $120.
Hopefully, you have enjoyed today’s article. Thanks for reading!
Have a fantastic day!
Live from the Platinum Crypto Trading Floor.
Earnings Disclaimer: The information you’ll find in this article is for educational purpose only. We make no promise or guarantee of income or earnings. You have to do some work, use your best judgement and perform due diligence before using the information in this article. Your success is still up to you. Nothing in this article is intended to be professional, legal, financial and/or accounting advice. Always seek competent advice from professionals in these matters. If you break the city or other local laws, we will not be held liable for any damages you incur.
")