
Bitcoin exchange-traded funds (ETF) have attracted strong inflows from the investors in January. A Morningstar report on Feb. 3 shows that BlackRock and Fidelity’s spot Bitcoin ETFs ranked eighth and tenth among ETFs in the United States. On the flip side, the Grayscale Bitcoin Trust (GBTC) witnessed the second highest outflows among ETFs in the first month of the year.
A minor ray of hope for the bulls is that the outflows in GBTC are beginning to slow down. CoinShares data shows that digital investment products witnessed inflows of $708 million last week, taking the total year-to-date inflows to $1.6 billion.
Bitcoin was volatile in January, but ended with a minor rise of 0.7% as markets digested the launch of Bitcoin ETFs and the subsequent outflows from GBTC. ARK Invest CEO Cathie Woods said in a chat with chief futurist Brett Winton that the launch of the ETFs have been attracting gold investors into Bitcoin. Wood anticipates Bitcoin to prove its billing as a “risk off asset” during times of economic uncertainty.
As the hype fades around the ETFs, macroeconomic factors and Bitcoin halving are likely to remain in focus. Market intelligence platform DecenTrader said in a blog post on February 2 that Bitcoin may stay range-bound until the second week of March when buying begins. DecenTrader anticipates Bitcoin to hit a new all-time high in “mid to late Q4 of 2024.”
Bitcoin is likely to receive tailwinds from the rate cuts by the Federal Reserve in 2024. In an interview with CBS’ “60 Minutes,” Fed Chair Jerome Powell said that “time is coming” to cut rates, but not likely in the March meeting. Market observers believe the rate cuts may begin in May or June. An expansionary monetary policy is expected to be bullish for the crypto markets.
Will Bitcoin’s range-bound action trigger buying in major altcoins? Let’s study the charts to find out.
BTC/USD Market Analysis
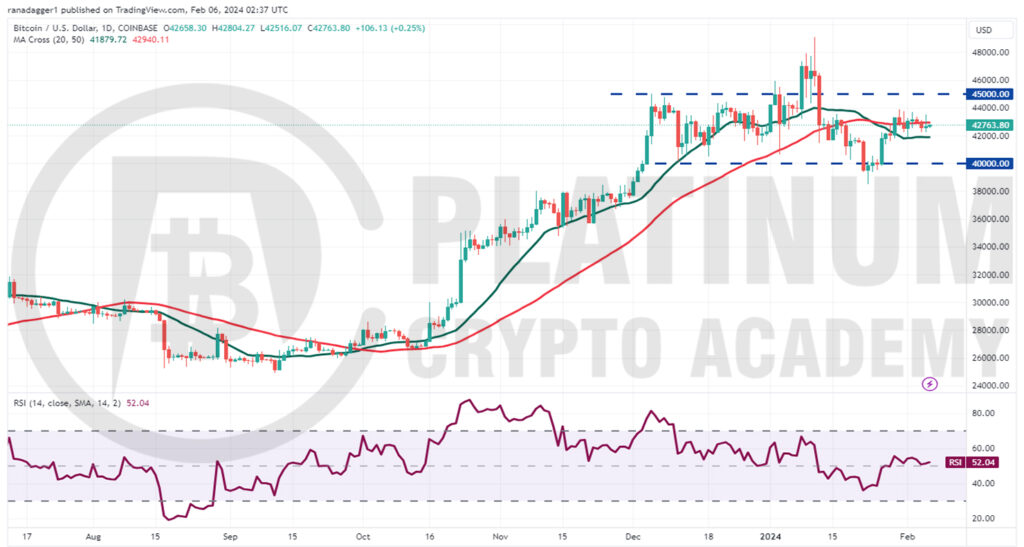
Bitcoin plunged below $40,000 on January 22, but the bears could not sustain the lower levels. That attracted aggressive buying by the bulls who pushed the price back above $42,000 on January 26.
Both moving averages have flattened out and the relative strength index (RSI) is near the midpoint, indicating a balance between supply and demand. The BTC/USD pair may oscillate between $40,000 and $45,000 for a few days.
It is usually tricky to predict the direction of the breakout from a range. If buyers drive the price above $45,000, the bullish momentum could pick up. The pair may then rally to the psychologically crucial level of $50,000.
The bears are expected to defend the $50,000 level with vigor, but if the bulls do not give up much ground, it will enhance the prospects of the continuation of the uptrend. The pair may then rise to $52,000.
Contrarily, if the price breaks below $40,000, it will indicate that the bears have overpowered the bulls. That may signal the start of a deeper correction toward the next major support at $35,500. The downside looks limited as buyers are likely to aggressively buy the dips.
ETH/USD Market Analysis
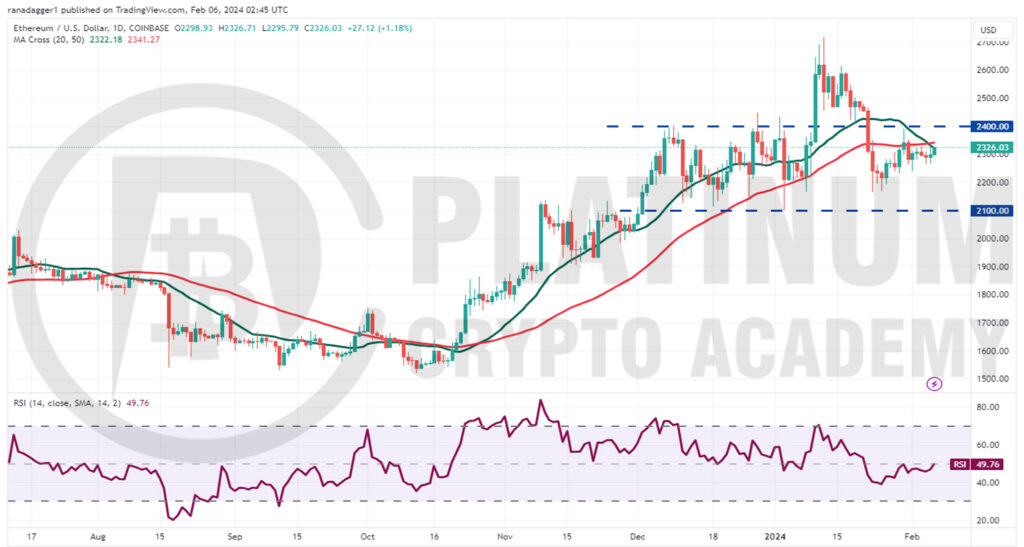
Ether attempted to rise above the overhead resistance of $2,400 on January 30, but the bears held their ground. This suggests that the bears remain active at higher levels.
The downsloping 20-day exponential moving average (EMA) indicates advantage to bears, but the flattening RSI suggests that the bearish momentum is slowing down.
If buyers push the price above the moving averages, the ETH/USD pair could climb to $2,400. This remains the key short-term resistance to watch out for. If bulls clear this hurdle, the pair may surge to $2,700.
Alternatively, if the price turns down sharply from the moving averages, the pair may slide to $2,233 and then to the strong support at $2,100.
The bulls are expected to defend this level with all their might because a break below it will signal the start of a downtrend. The next support on the downside is at $1,900.
BNB/USD Market Analysis
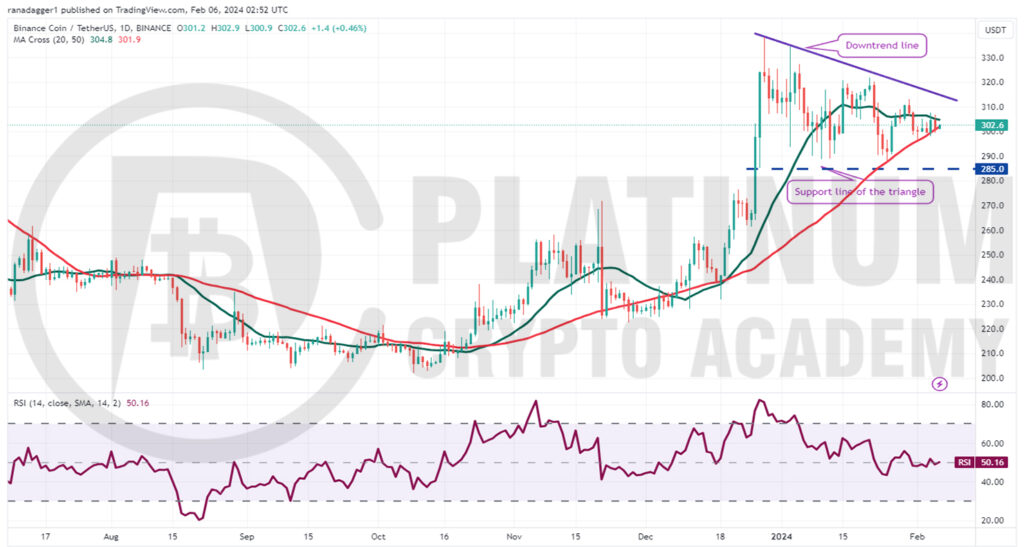
Binance Coin has been trading inside a descending triangle pattern, which will complete on a break and close below $285. However, a positive sign is that the bulls are trying to defend the 50-day simple moving average (SMA).
If the price turns up from the current level and rises above the 20-day EMA, it will suggest that the bulls are attempting a comeback. Buyers will then try to challenge the downtrend line.
A break and close above the downtrend line will invalidate the bearish setup, which is likely to attract buyers. The BNB/USD pair could then attempt a rally to the local high at $338.
Conversely, a drop below the 50-day SMA will tilt the advantage in favor of the bears. The pair could then skid to the strong support at $285. If this support gives way, the pair may start a decline toward $260.
XRP/USD Market Analysis
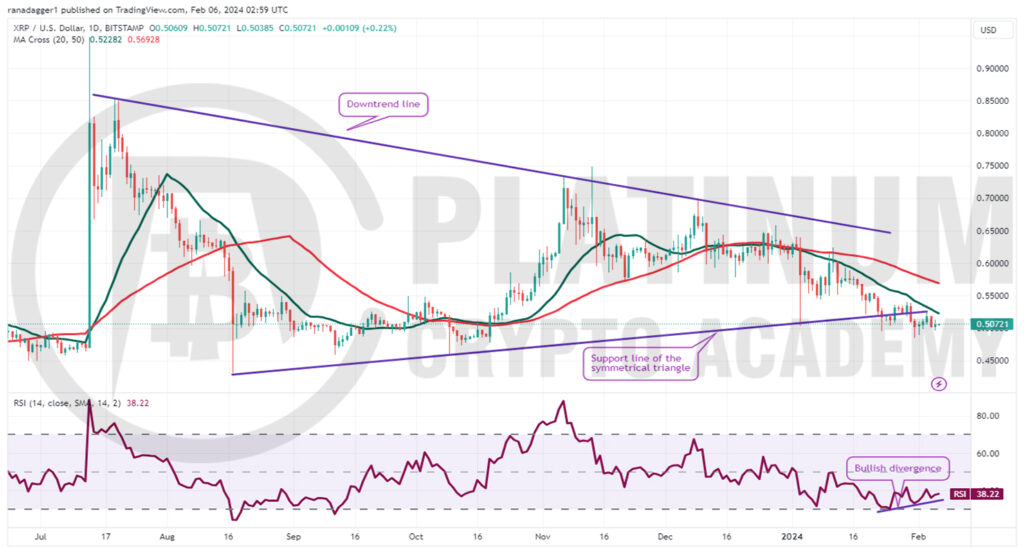
The bears yanked XRP below the support line of the symmetrical triangle pattern on January 23. The bulls started a relief rally on January 26, but they could not push the price above the 20-day EMA. This shows that the sentiment remains negative and traders are selling on every minor rise.
Buyers are trying to protect the $0.50 level on the downside, but the weak bounce increases the risk of a further downside. If the price breaks below $0.48, the XRP/USD pair may plunge to $0.43.
Although the downsloping moving averages indicate advantage to sellers, the RSI is showing first signs of forming a bullish divergence. This indicates that the selling pressure could be reducing.
If buyers kick the price above the 20-day EMA, the pair could rally to the 50-day SMA and later to the downtrend line.
ADA/USD Market Analysis
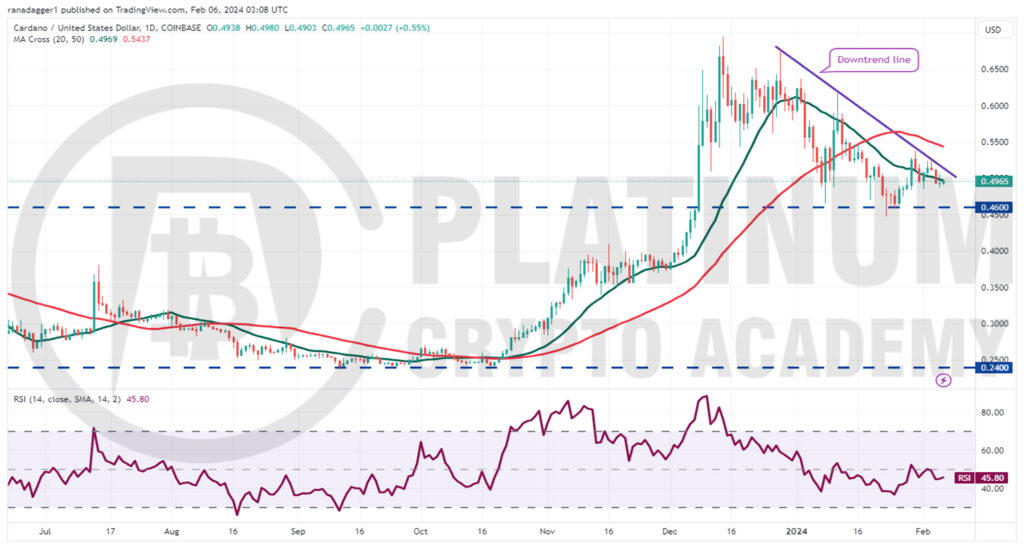
Cardano bounced off the breakout level of $0.46 on January 26 and broke above the 20-day EMA on January 29, but the bulls could not sustain the momentum and overcome the obstacle at the downtrend line.
Both moving averages are sloping down, but the RSI has risen above 45, indicating that the bears may be losing their grip.
A break and close above the downtrend line will be the first sign of strength. The ADA/USD pair could rise to the 50-day SMA and thereafter surge to $0.62.
This positive view will be negated in the near term if the price turns down and dives below the critical support at $0.46. If that happens, the pair may start a downward move to $0.40 where the bulls will again try to arrest the decline.
Hopefully, you have enjoyed today’s article for further coverage please check out our crypto Blog Page. Thanks for reading! Have a fantastic day! Live from the Platinum Crypto Trading Floor.
Earnings Disclaimer: The information you’ll find in this article is for educational purpose only. We make no promise or guarantee of income or earnings. You have to do some work, use your best judgement and perform due diligence before using the information in this article. Your success is still up to you. Nothing in this article is intended to be professional, legal, financial and/or accounting advice. Always seek competent advice from professionals in these matters. If you break the city or other local laws, we will not be held liable for any damages you incur.
