
Bitcoin continued its slide to reach a six-week low below $40,000 on January 20. The sell-off following the launch of Bitcoin exchange-traded funds (ETF) on January 11 shows that cryptocurrency traders bought the rumor and sold the news.
While most of the recently approved Bitcoin ETFs have been seeing strong inflows, Grayscale Bitcoin Trust (GBTC) has seen more than $2.8 billion in net outflows. FTX’s bankruptcy estate was the major seller, offloading shares valued at nearly $1 billion.
JPMorgan analyst Nikolaos Panigirtzoglou said in a recent post that “up to $3bn had been invested into GBTC in the secondary market during 2023 in order to take advantage of the discount to NAV.” He expects the arbitrageurs to book profits, putting Bitcoin under pressure in the next few weeks.
The institutional investors have also been scaling back their Bitcoin purchases. According to CoinShares’ “Digital Asset Fund Flows Weekly” report published on Jan. 22, Bitcoin investment products witnessed minor outflows of about $25 million past week, while short Bitcoin products saw inflows of $12.7 million.
BitMEX founder Arthur Hayes is bearish on Bitcoin in the short term. Hayes said in a X post on January 22 that he purchased $35,000 strike puts expiring on 29 March as he anticipates a “dump into the 31 January US Treasury quarterly refunding announcement.”
However, it is not all gloom and doom in the Bitcoin ETF space. Bloomberg senior ETF analyst Eric Balchunas tweeted on January 20 that the nine Bitcoin ETFs, barring GBTC, have witnessed massive inflows, boosting their assets under management to $4 billion.
After the initial selling, Bitcoin is likely to stabilize as long-term investors are expected to view the dips as a buying opportunity.
Could Bitcoin and major altcoins turn around and move higher in the near term or will more selling follow? Let’s study the charts to find out.
BTC/USD Market Analysis
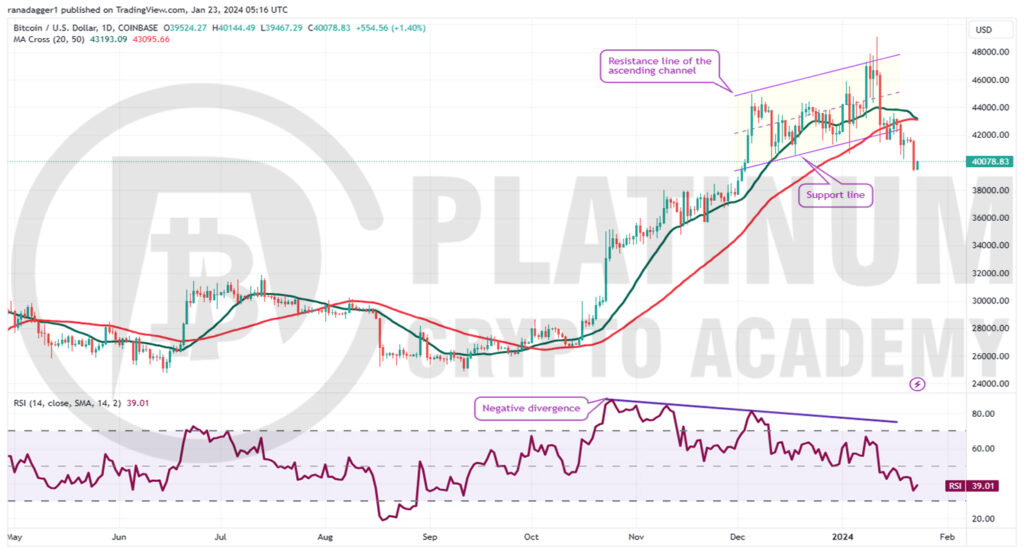
Bitcoin surged above the resistance line of the ascending channel pattern on January 11, but the bulls could not sustain the higher levels. That may have tempted profit-booking by the bulls, which pulled the price down to the support line on January 12. After a few days of consolidation, the selling resumed on January 18.
The moving averages have completed a bearish crossover, and the relative strength index (RSI) is in the negative territory, indicating that the bears are trying to take charge.
The $40,000 level is the crucial support to watch out for on the downside. If the price rebounds off the current level and rises above the moving averages, it will suggest that the corrective phase may be over.
On the other hand, if the price turns down from the moving averages once again, it will suggest that the sentiment has turned negative and traders are selling on rallies. That will increase the likelihood of a drop below $40,000.
If that happens, the BTC/USD pair could plummet to the next major support near $35,500.
ETH/USD Market Analysis
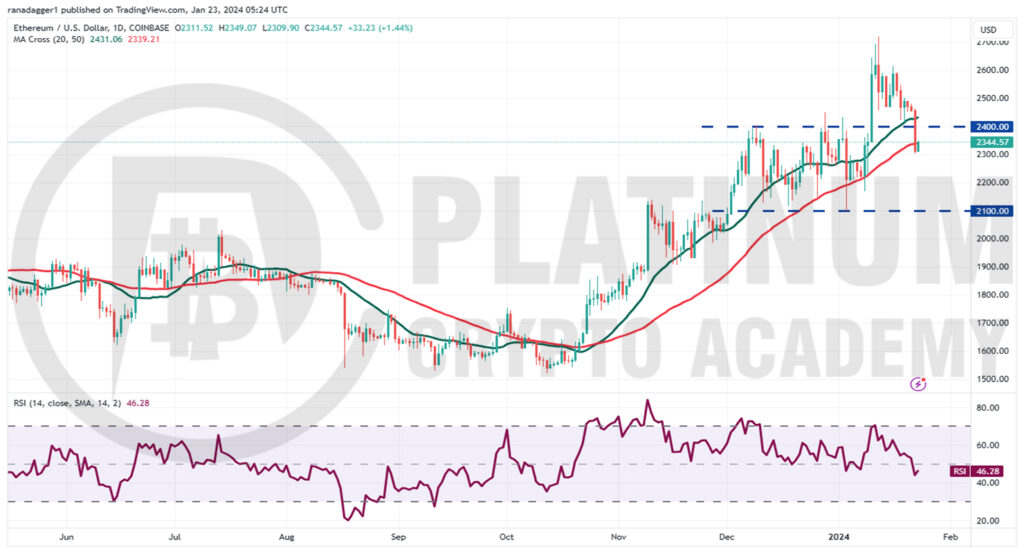
Ether skyrocketed above the $2,400 overhead resistance on January 10 and reached its target objective of $2,700 on January 12. This level saw aggressive profit booking by the bears, which started a pullback toward the breakout level.
Buyers tried to start a rebound off $2,400 on January 19, but the bears did not relent. They continued selling and pulled the price back below the moving averages on January 22.
Any pullback from the current level is likely to face selling at the 20-day exponential moving average (EMA). If the price turns down from the 20-day EMA and breaks below $2,400, the possibility of a fall to $2,100 increases. The bulls are likely to defend this level aggressively.
On the upside, a break and close above the 20-day EMA will be the first indication of comeback by the bulls. The ETH/USD pair may then again attempt to climb to $2,600 and later to $2,700.
BNB/USD Market Analysis
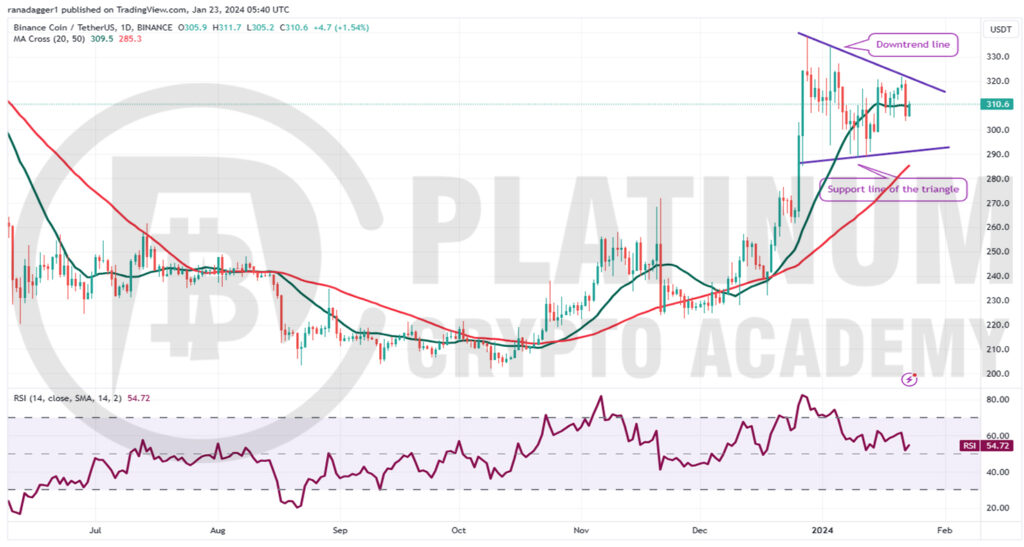
Binance Coin reversed direction from the downtrend line on January 21, indicating that the bears are fiercely defending the level. The 20-day EMA has flattened out, and the RSI is near the midpoint, indicating that the bulls are losing their steam.
The price action of the past few days has formed a symmetrical triangle, which generally acts as a continuation pattern. Buyers will have to drive and sustain the price above the triangle to indicate the resumption of the uptrend. The pattern target of the setup is $372.
If the price remains below the 20-day EMA, the selling could pick up, and the price may dip to the support line of the triangle. This remains the key short-term level to watch out for because a break below it may accelerate selling.
If the bears yank the price below the triangle, the BNB/USD pair could plunge to $260 and thereafter to $238. Such a move will signal that the triangle has formed a reversal setup.
XRP/USD Market Analysis
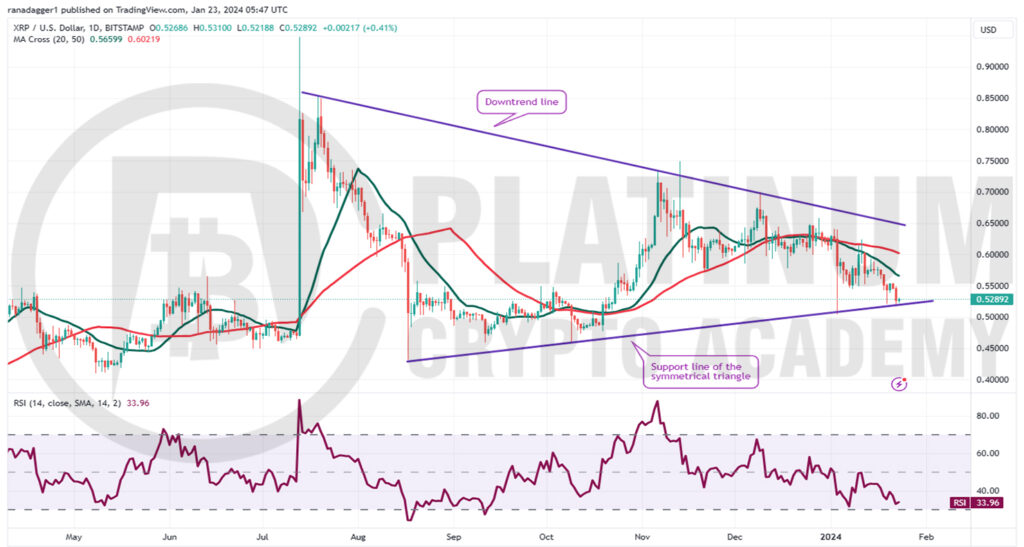
The bulls tried to push XRP above the 50-day simple moving average (SMA) on January 11, but the bears did not relent. That resumed selling, and the bears pulled the price to the support line of the symmetrical triangle on January 19.
The 20-day EMA is turning down, and the RSI is near the oversold territory, indicating that the bears are in command. The selling pressure is likely to increase if the support line gives way. That could start a downward move to the vital support near $0.40.
Contrarily, if the price rebounds off the support line and rises above the moving averages, it will suggest that the XRP/USD pair may spend some more time inside the triangle. The bulls will be back on track after the price jumps above the downtrend line.
ADA/USD Market Analysis
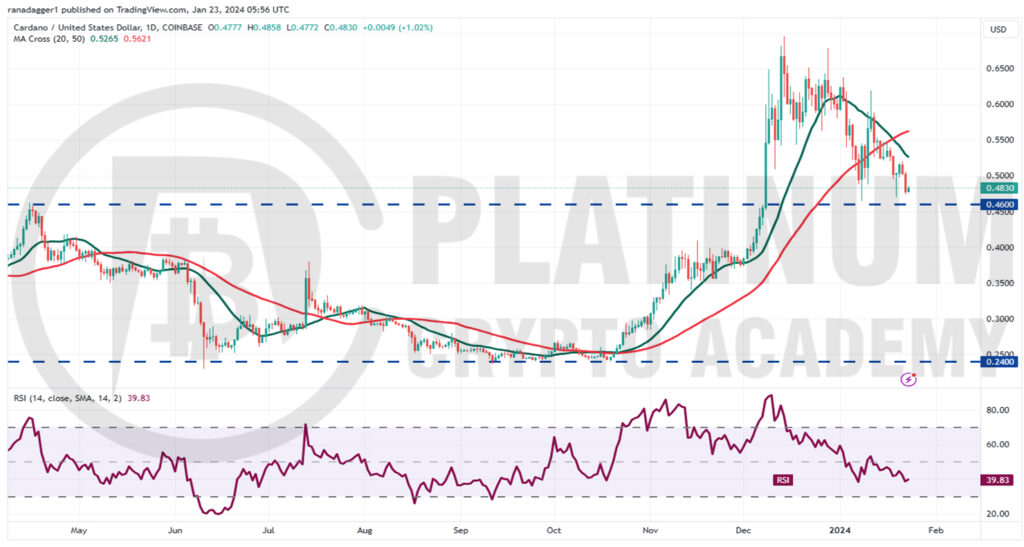
Cardano snapped back sharply from the breakout level of $0.46 on January 8, but the relief rally met with intense selling pressure at the 20-day EMA. This suggests that the bears are viewing the rallies as a selling opportunity.
The price has again reached the $0.46 support, an important level to keep an eye on. The downsloping 20-day EMA and the RSI below 40 suggest that the bears hold the edge.
If bears tug the price below $0.46, it will signal the start of a new downward move. The ADA/USD pair could dive to the strong support near $0.40.
Conversely, the bulls will attempt to drive the price above the 20-day EMA. If they do that, the pair could rise to the overhead resistance of $0.62, where the bears are again likely to mount a strong defense.
Hopefully, you have enjoyed today’s article for further coverage please check out our crypto Blog Page. Thanks for reading! Have a fantastic day! Live from the Platinum Crypto Trading Floor.
Earnings Disclaimer: The information you’ll find in this article is for educational purpose only. We make no promise or guarantee of income or earnings. You have to do some work, use your best judgement and perform due diligence before using the information in this article. Your success is still up to you. Nothing in this article is intended to be professional, legal, financial and/or accounting advice. Always seek competent advice from professionals in these matters. If you break the city or other local laws, we will not be held liable for any damages you incur.
