
The bulls are attempting to start a recovery in Bitcoin and the altcoins but strong selling at higher levels indicates a risk to the downside.
Tight range trading is usually followed by an expansion in volatility and that is what happened with Bitcoin on August 17. Bitcoin plunged more than 10% during intraday trading but then recovered some of its losses and finished the day down about 7%. There was no specific news that caused the fall but some analysts believe that rumors of SpaceX having sold its Bitcoin holdings may have caused panic amongst traders.
Whatever the cause, the sharp decline resulted in massive liquidations for derivatives traders. The billion-dollar liquidation was the biggest since the FTX collapse in 2022. Forced liquidation of leveraged positions and stops of short-term traders getting hit may have exacerbated the decline.
The latest fall pulled the price below the Short-Term Holder (STH) cost basis which generally acts as a support during uptrends, according to Glassnode’s weekly onchain newsletter released on August 21. With a cost basis of $28,600, about 88% of the STHs are under loss. Glassnode cautioned that the STHs cohort is “increasingly price sensitive.” However, a positive sign is that the Long-Term Holders have not panicked and remained unresponsive during the fall.
Other than the sharp decline, CoinShares said in its Digital Asset Fund Flows Weekly Report that media reports highlighting reduced expectations of a spot Bitcoin exchange-traded fund being greenlighted by the US Securities and Exchange Commission in the near future may have led to the outflows of $55 million from digital asset investment products.
In the short term, traders will keep a close eye on the macroeconomic data and the Federal Reserve Chair Jerome Powell’s speech on August 25 at Jackson Hole, Wyoming. If Powell doesn’t throw a negative surprise, history suggests that US stocks generally rally in the week after the Fed chair’s speech.
Could the rally in US stocks boost recovery in the cryptocurrency markets? Let’s study the charts of Bitcoin and the major altcoins to find out.
BTC/USD Market Analysis
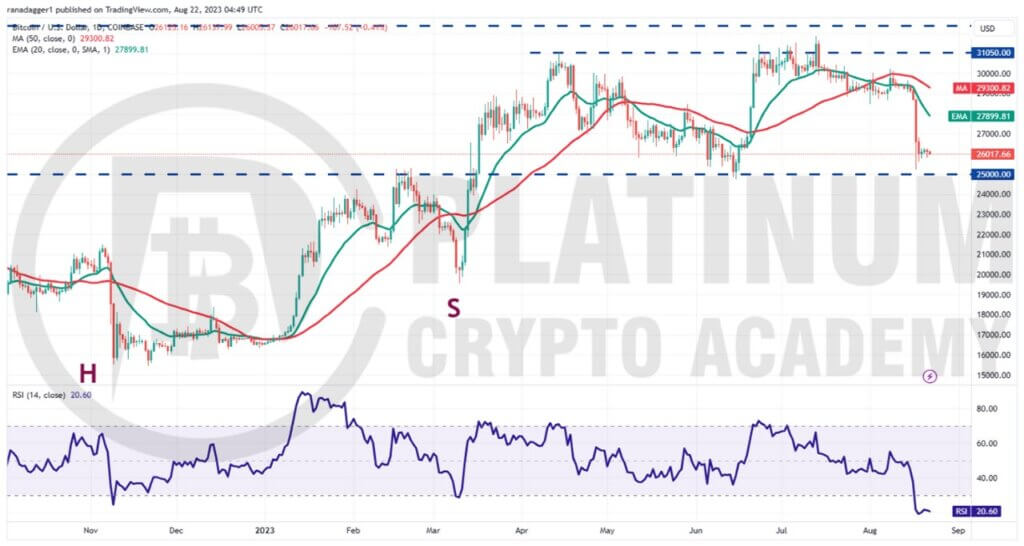
We warned in the previous analysis that if Bitcoin plummets below $28,477, it could start a downward move to $27,000 and then stay range-bound between $25,000 and $31,050 for some time and that is what happened.
The bulls failed to sustain the BTC/USD pair above the 20-day exponential moving average (EMA) on August 14, and that started a sell-off on August 15. The bearish momentum picked up on August 17 and the pair nosedived near the critical support at $25,000.
Buyers are trying to start a recovery but the shallow bounce suggests a lack of urgency among the bulls to buy at current levels. A weak bounce will encourage the bears to make another attempt to break the $25,000 support.
If they succeed, the pair could start a deeper correction toward $20,000. There is a minor support at $24,000 but that may not hold.
A ray of hope for the bulls is that the relative strength index (RSI) is in the oversold territory. This indicates that the selling may have been overdone in the near term and a recovery or consolidation is possible.
On the upside, a break and close above $27,000 could start a relief rally to the 20-day EMA. A break and close above this level will indicate that the range-bound action may extend for a few more days.
ETH/USD Market Analysis
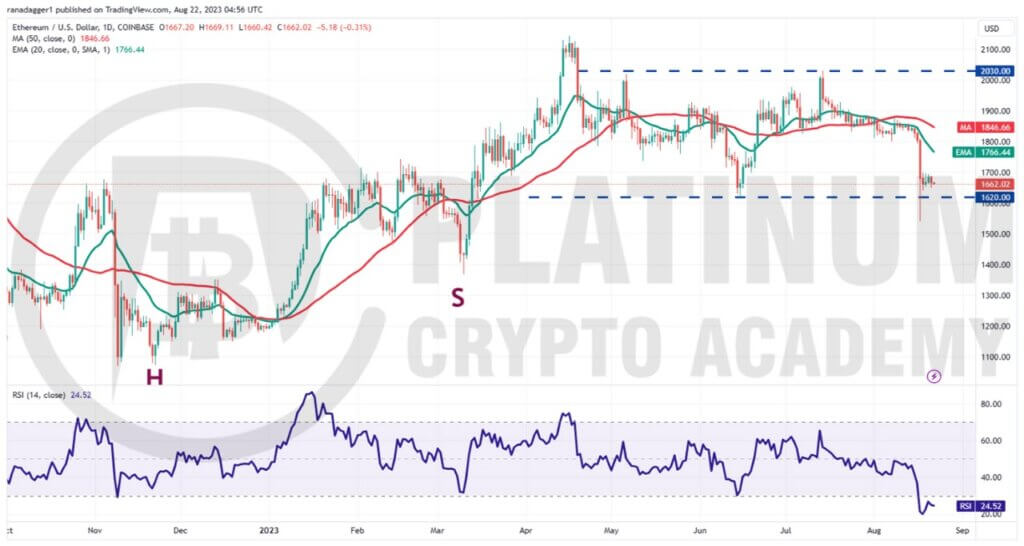
We cautioned traders in the previous analysis that the indicators suggested a slight edge to the bears. We also mentioned that if the $1,800 level cracks, Ether could plummet to $1,620 and that happened on August 17.
The ETH/USD pair plunged below $1,620 but the bulls purchased this dip as seen from the long tail on the day’s candlestick. However, the bulls could not drive the price above $1,700 signaling that bears are selling on minor rallies.
The downsloping moving averages and the RSI in the oversold territory indicate that bears are in command. Sellers will once again try to sink the price below $1,620 and challenge the support at $1,540. If this support gives way, the pair could descend to $1,369.
Contrary to this assumption, if the price turns up from the current level and rises above $1,700, it will suggest the start of a stronger recovery. The pair may first rise to the 20-day EMA and then to the 50-day SMA.
BNB/USD Market Analysis
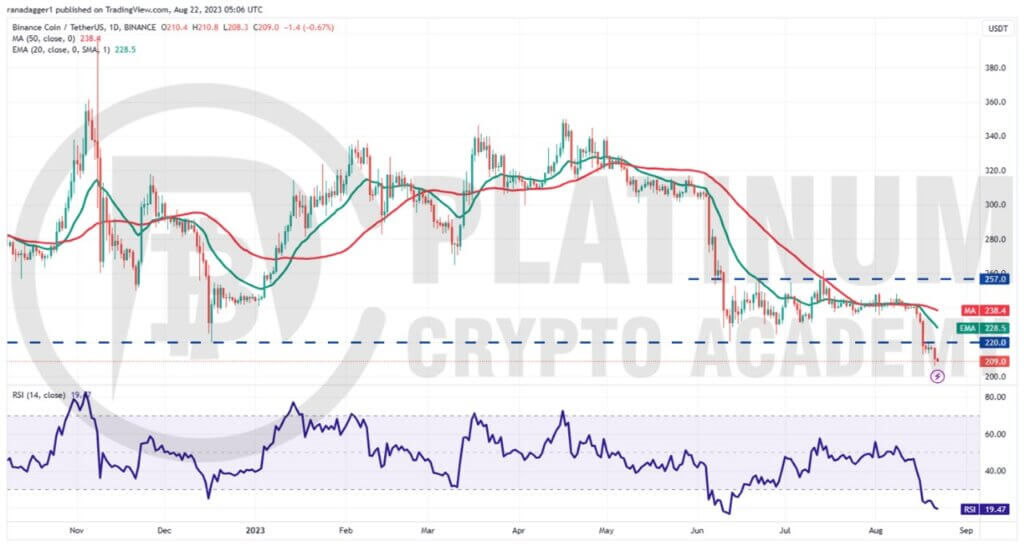
We expected Binance Coin to stay inside the range between $220 and $257 but that did not happen. The sharp fall on August 17 pulled the price below the range. This indicates that supply exceeds demand.
Buyers tried to push the price back above $220 but the bears held their ground. This shows that the bears have flipped the $220 level into resistance. The BNB/USD pair resumed its downtrend on August 21.
The next level to watch on the downside is the psychological support at $200. If this level also gives way, the pair could reach $183.
The important level to watch on the upside is the breakdown level of $220. Buyers will have to propel and sustain the price above this resistance to suggest that the breakdown may have been a bear trap. That could start a relief rally to $235.
XRP/USD Market Analysis
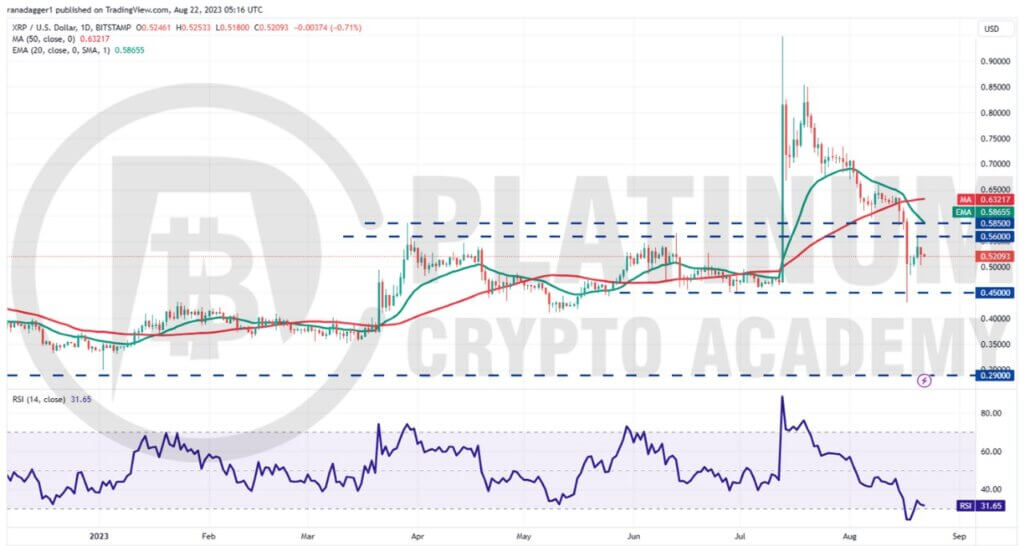
We said in our previous analysis that if bulls fail to propel XRP above the 20-day EMA, the selling could intensify and the $0.58 to $0.56 support zone may crack. We also projected that the XRP/USD pair may complete a 100% retracement of the most recent leg of the rally and plunge to $0.45 and that is how it played out.
The pair fell below $0.45 on August 17 but the bulls purchased this dip and started a recovery. Buyers tried to thrust the price above $0.56 on August 20 but the bears held their ground. This suggests that the bears are trying to flip the $0.56 to $0.58 zone into resistance.
The downsloping 20-day EMA and the RSI in the negative territory indicate that bears remain in command. The XRP/USD pair could swing between $0.45 and $0.58 for a few days.
If bulls want to make a comeback, they will have to drive and sustain the price above the moving averages. If they manage to do that, it will indicate aggressive buying at lower levels. On the other hand, a break and close below $0.45 could start the next leg of the downtrend to $0.40 and then to $0.35.
ADA/USD Market Analysis
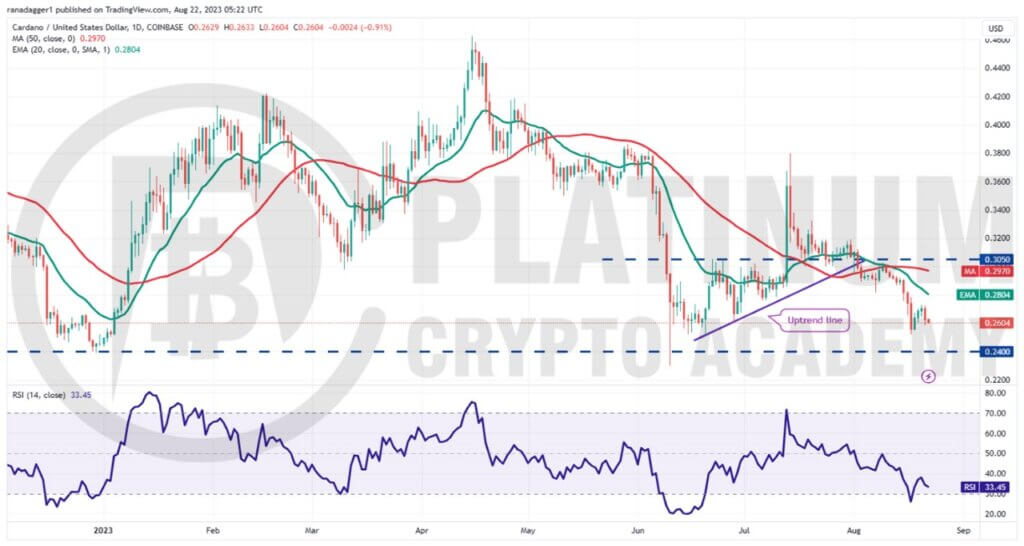
We mentioned in our previous analysis that if Cardano dips below $0.28, it could start a down move to $0.26 and subsequently to $0.24 and that is how it has been. The bulls are trying to protect the $0.25 level with vigor.
However, the downsloping 20-day EMA and the RSI in the negative zone indicate that bears have the upper hand. If the price skids below $0.25, the ADA/USD pair may reach strong support at $0.24.
Buyers are expected to defend this level with all their might because if $0.24 breaks down, the pair may resume its downtrend.
Alternatively, if the price turns up from the current level or the support at $0.24 and rises above the 20-day EMA, it will indicate the start of a stronger recovery. The pair may then attempt a rally to $0.30.
Hopefully, you have enjoyed today’s article for further coverage please check out our crypto Blog Page. Thanks for reading! Have a fantastic day! Live from the Platinum Crypto Trading Floor.
Earnings Disclaimer: The information you’ll find in this article is for educational purpose only. We make no promise or guarantee of income or earnings. You have to do some work, use your best judgement and perform due diligence before using the information in this article. Your success is still up to you. Nothing in this article is intended to be professional, legal, financial and/or accounting advice. Always seek competent advice from professionals in these matters. If you break the city or other local laws, we will not be held liable for any damages you incur.
