
Bitcoin finished the first quarter of 2024 with massive gains of 68.50%. A large part of the rally was fuelled by the launch of the spot Bitcoin exchange-traded funds, which saw strong inflows. Bitcoin’s rise boosted sentiment, resulting in sharp rallies in several altcoins. The question troubling investors is whether the rally will continue or is it time for a correction?
The next major event to watch out for is Bitcoin’s halving, which is expected to happen in about 18 days. Historical data shows that Bitcoin made a new all-time high 12-18 months following the halvings in November 2012, July 2016, and May 2020. However, in 2024, Bitcoin hit a new high prior to the halving. This has made some analysts cautious who expect Bitcoin to witness a short-term sell-off after the event.
While the short term is uncertain, analysts remain bullish for the medium and long term. Morgan Creek Capital Management CEO and chief investment officer Mark Yusko predicts Bitcoin will more than double and hit $150,000 this year. He believes investors should allocate between 1% to 3% to Bitcoin in their portfolios. Yusko is super bullish for the long term, expecting Bitcoin to “go up 10x from here easily over the next decade.”
Although Bitcoin ETFs have been star performers in Q1 2024, the institutional inflow has been slow. That could change over the next few years as fund managers controlling around $100 trillion in assets under management allocate roughly 1% to Bitcoin ETFs, bringing inflows of $1 trillion, said Matt Hougan, the CIO of crypto index fund manager Bitwise, in a memo to investment professionals.
BlackRock CEO Larry Fink said in an interview with Fox Business that he was “pleasantly surprised” by how well the spot Bitcoin ETF had performed. He added that he was “very bullish on the long-term viability of Bitcoin.”
What are the important support levels to watch out for in Bitcoin and the major altcoins? Let’s study the charts to find out.
BTC/USD Market Analysis
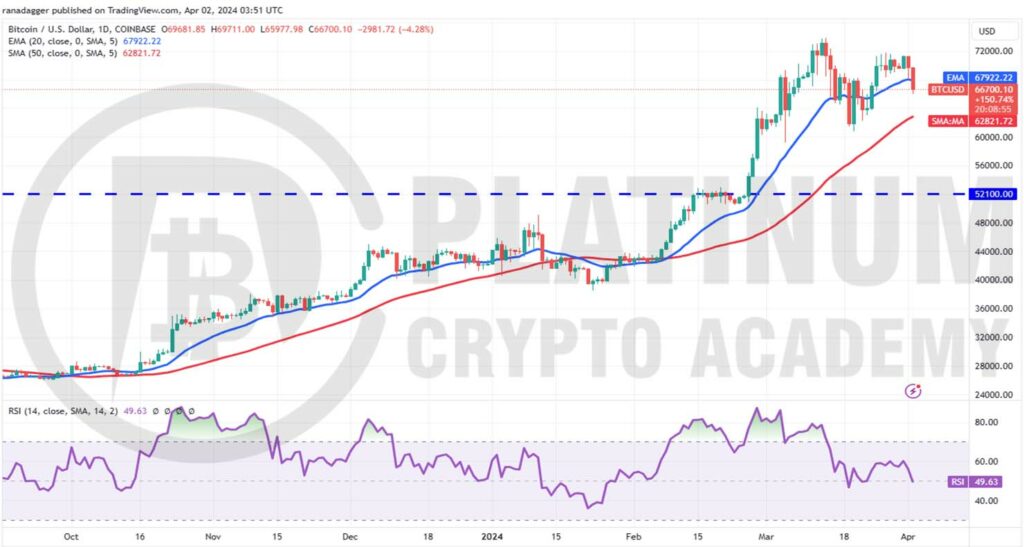
We cautioned traders in the previous analysis that a break below the 20-day exponential moving average (EMA) could sink Bitcoin to $59,224, and the BTC/USD pair fell to $60,771 on March 20.
Subsequent recovery fizzled out near $72,000, indicating that the bears are aggressively selling on rallies. The 20-day EMA is flattening out, and the relative strength index (RSI) has dropped to the midpoint, signaling that the bulls may be losing their grip.
If the price maintains below the 20-day EMA, the pair could reach the 50-day simple moving average (SMA). This is a key support to watch out for in the near term because a break and close below it may accelerate selling.
The $59,224 level may act as a minor support, but it is likely to be broken. The pair may then plummet to the breakout level of $52,100.
Contrarily, if the price turns up from the current level or the 50-day SMA, the bulls will again try to overcome the overhead resistance between $72,000 and $73,835. If they succeed, the pair may start a rally to $80,000.
ETH/USD Market Analysis
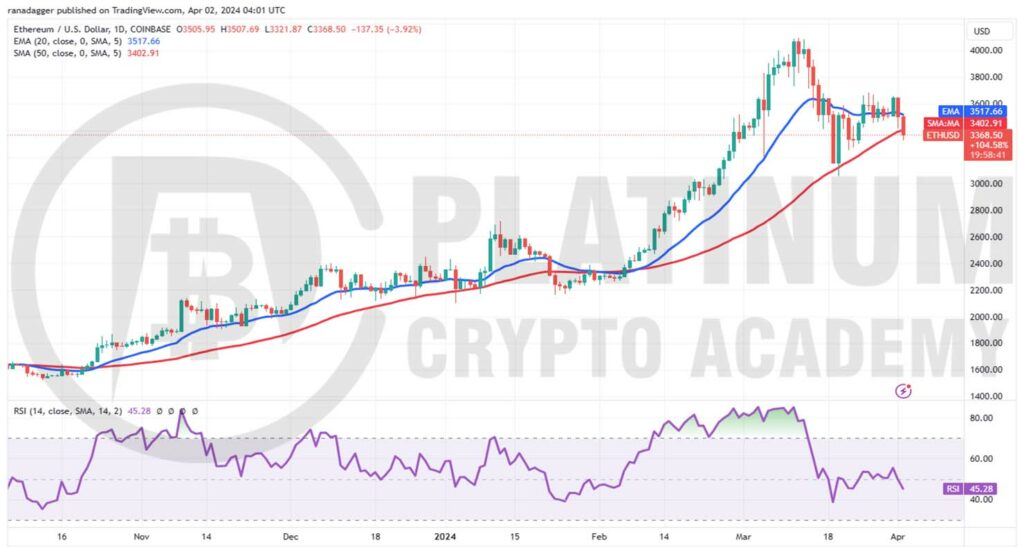
Our assumption that Ether will fall to the 50-day SMA where buyers will step in played out perfectly. We also said that the relief rally would face selling at the 20-day EMA, and that is what happened.
The failure to maintain the price above the 20-day EMA attracted selling, which pulled the price below the 50-day SMA. The 20-day EMA has flattened out, and the RSI has dipped below the midpoint, suggesting that the momentum is turning bearish.
If sellers maintain the price below the 50-day SMA, the ETH/USD pair could slide to $3,057, a crucial support to watch out for. If this level gives way, the selling could intensify, and the pair may plunge to $2,700.
Instead, if the price rebounds off $3,057, it will signal solid demand at lower levels. The pair may then swing between $3,057 and $3,682 for a few days. The bulls will have to push and sustain the price above $3,682 to signal a comeback.
BNB/USD Market Analysis
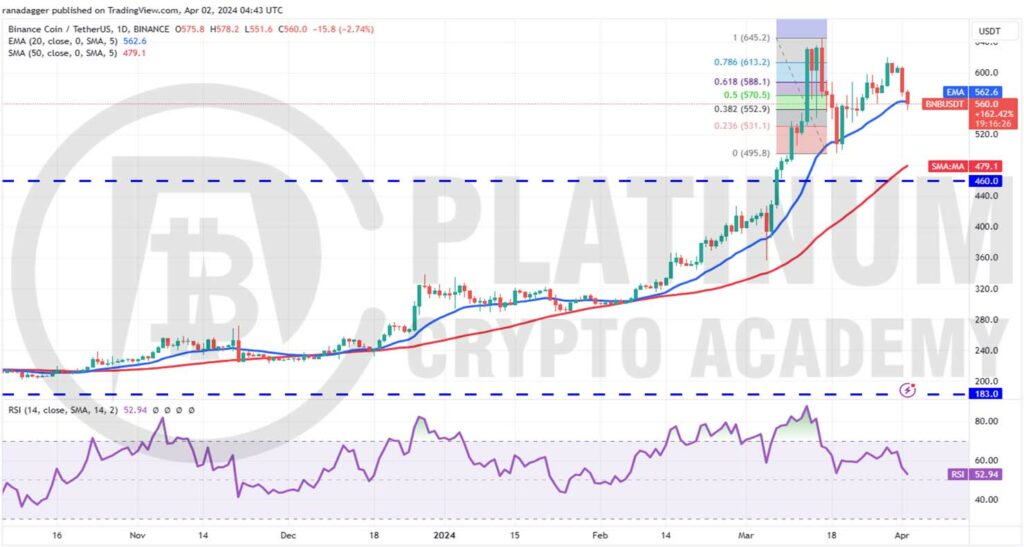
We mentioned in the previous analysis that Binance Coin is likely to witness a strong battle between the bulls and the bears at the 20-day EMA, and that is what happened. The recovery started toward $645, but the bears halted the march at $620 on March 29.
The bears are trying to sink the price below the 20-day EMA. If they do that, the BNB/USD pair could drop to the critical support at $496.
If the price rebounds off this level, the pair may remain range-bound between $496 and $645.
On the contrary, if the price slips below $498, the selling could intensify, and the pair may plunge to the breakout level of $460. The buyers are expected to defend the level with vigor.
The bulls will have to clear the overhead zone between $620 and $645 to indicate the resumption of the uptrend.
XRP/USD Market Analysis
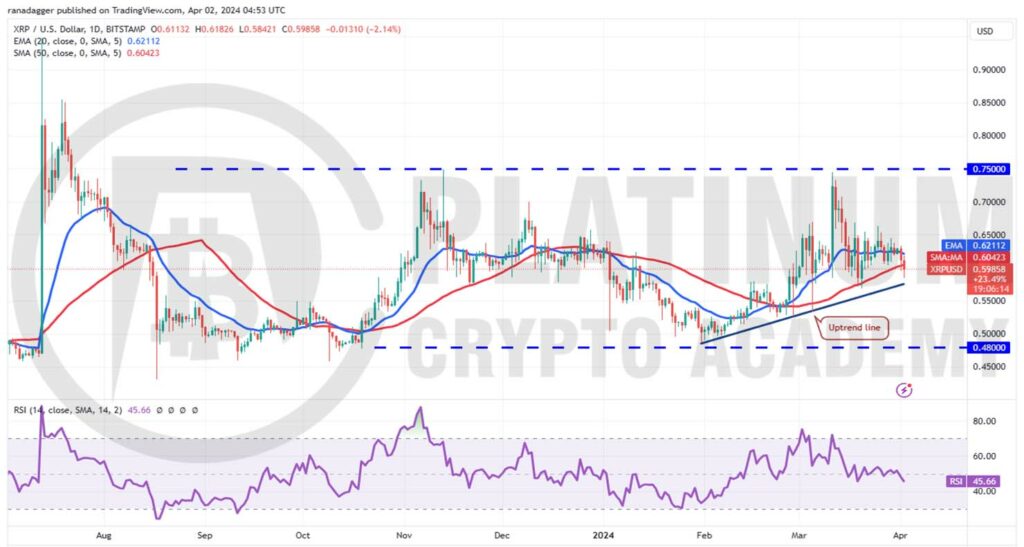
XRP has been swinging between $0.56 and $0.67 for several days. The flattish 20-day EMA and the RSI just below the midpoint suggest the range-bound action may continue for a while longer.
The critical support to watch on the downside is the uptrend line. If this support gives way, the selling could accelerate, and the XRP/USD pair may decline to $0.52, where the buyers may step in.
On the upside, the $0.67 level remains the key barrier to cross. If that is done, the pair is likely to pick up momentum and surge toward the formidable overhead resistance at $0.75.
Trading inside a range can be volatile and random. Hence, traders may wait for the breakout to happen before taking large positions.
ADA/USD Market Analysis
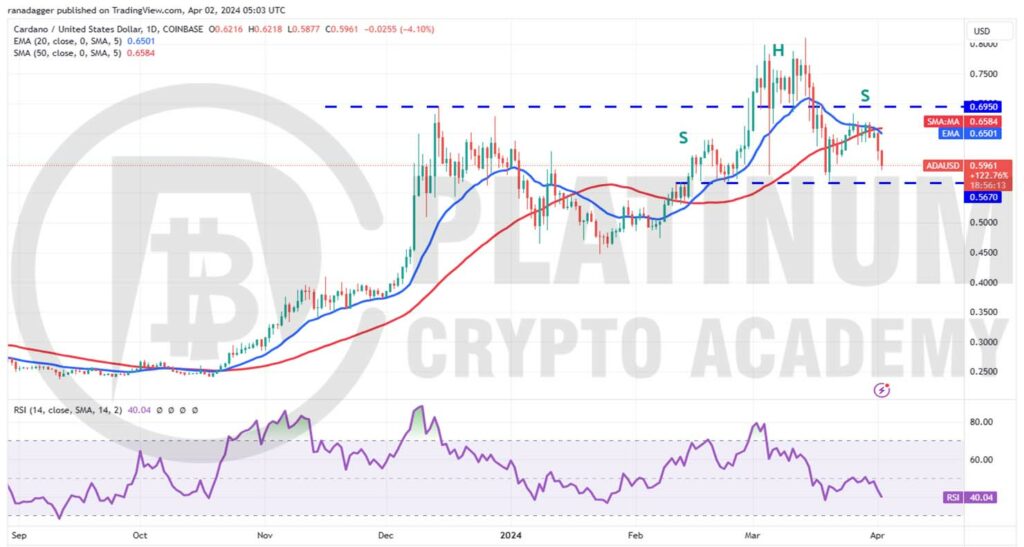
Cardano behaved the way we had predicted in the previous analysis. The break below the 50-day SMA pulled the ADA/USD pair to $0.57, close to our expected level of $0.56.
As we had projected, the recovery hit a wall at the 20-day EMA. This suggests that the sentiment has turned negative, and traders are selling on rallies.
The downsloping 20-day EMA and the RSI in the negative territory suggest that the path of least resistance is to the downside.
If the price breaks below the $0.56 level, the pair will complete a head-and-shoulders pattern, opening the doors for a further fall to the pivotal support at $0.45.
Contrarily, if the price rebounds off $0.56, it will indicate aggressive buying on dips. That could keep the pair stuck between $0.56 and $0.70 for some more time.
Hopefully, you have enjoyed today’s article for further coverage please check out our crypto Blog Page. Thanks for reading! Have a fantastic day! Live from the Platinum Crypto Trading Floor.
Earnings Disclaimer: The information you’ll find in this article is for educational purpose only. We make no promise or guarantee of income or earnings. You have to do some work, use your best judgement and perform due diligence before using the information in this article. Your success is still up to you. Nothing in this article is intended to be professional, legal, financial and/or accounting advice. Always seek competent advice from professionals in these matters. If you break the city or other local laws, we will not be held liable for any damages you incur.
