Hi Crypto Network,
Quantum Economics founder Mati Greenspan said that the correlation between the S&P 500 and Bitcoin was at a 9-Year High. According to him, Bitcoin has behaved as a risky asset rather than a safe haven in the current crisis.
If the correlation holds up, then it would be negative for Bitcoin because analysts at Goldman Sachs have forecast “below-average market returns and eventual momentum reversals” in the US equity markets.
However, we have a different view because we believe that after the panic state when investors sold everything to raise cash, Bitcoin will chart its own course. While the world is seeing a flush of monetary and fiscal stimulus, which will eventually devalue the fiat currencies, Bitcoin will halve the miner’s rewards in less than two weeks. This highlights that Bitcoin is an asset that cannot be controlled and manipulated by the governments and central banks.
Venture capitalist Tim Draper expects people to turn to crypto as the massive stimulus debases the value of the US dollar. Draper also believes that the commercial adoption of Bitcoin will rise as retailers will look to crypto to save the 2.5-4% they pay the “banks every time somebody swipes a credit card.” Therefore, he has maintained his Bitcoin target of $250,000 by the end of 2022 or early 2023.
However, billionaire Mark Cuban is unimpressed by Bitcoin as he argues that it is complicated to use and it cannot be used to buy goods without fiat conversion. Hence, he prefers bananas to Bitcoin. Nevertheless, if in the future, if it becomes easy to use Bitcoin, then he could change his opinion.
BTC/USD
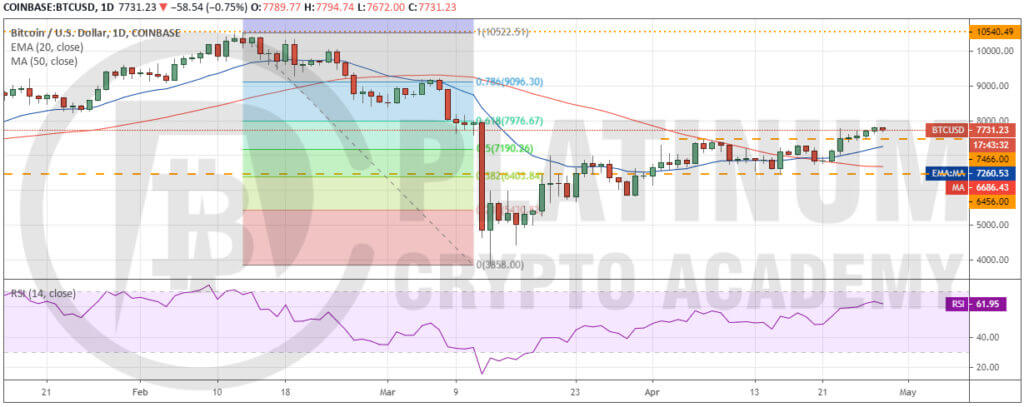
Bitcoin broke above the overhead resistance of $7,466 on April 23 but the bulls could not sustain the breakout. For the next two days, the price remained close to the breakout level of $7,466, before moving higher on April 26.
The upsloping 20-day EMA and the RSI in the positive territory suggest that bulls have the upper hand. However, the uptrend lacks momentum. This indicates that the bulls are not confident that the rally will continue for long, hence, they keep booking profits at every overhead resistance.
Currently, the bears are attempting to sink the price back below $7,466. Just below this level is the 20-day EMA. If the pair bounces off $7,466 or the 20-day EMA, it will indicate buying on minor dips, which will increase the possibility of a move to the $8,000-$8,187.03 resistance zone. A breakout of this zone can result in a rally to $9,214.67.
Conversely, if the bears sink the BTC to USD pair below the 20-day EMA, it will signal weakness. Below this level, a drop to $6,456 is possible.
ETH/USD
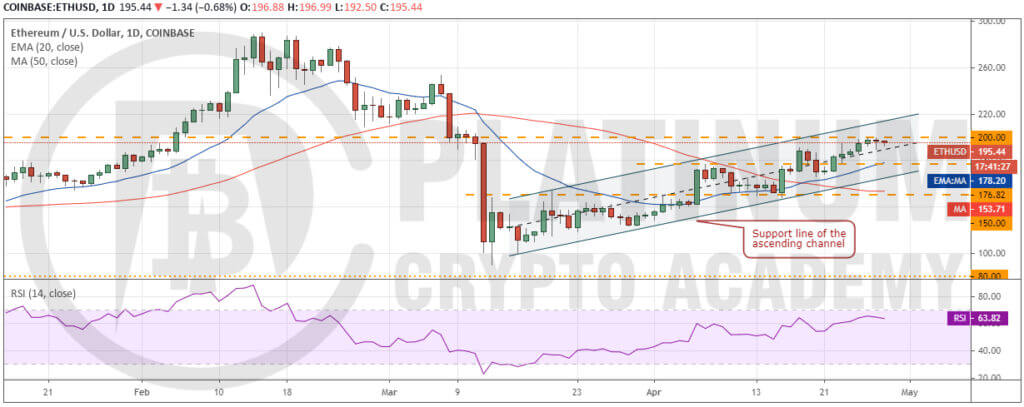
For the past three days, the bulls have not been able to scale the price above the overhead resistance of $200. This shows that the bears are aggressively defending this level.
If the ETH to USD pair dips below $189.60, a drop to the 20-day EMA at $178 is likely. A break below this level can retest the support line of the channel.
Nevertheless, Ether remains in an uptrend as long as it continues to trade inside the ascending channel. If the price stays in the upper half of the channel, it suggests strength. When the price dips and sustains in the lower half of the channel, it indicates that the bears are trying to make a comeback.
As the 20-day EMA is sloping up and the RSI remains in the positive territory, the bulls are likely to aggressively defend the dip to the 20-day EMA. A strong bounce off this support can carry the price to the $200-$208.65 resistance zone.
The pair will pick up momentum after the bulls push the price above the channel. The first target on the upside is $253.01 and then $290.
XRP/USD
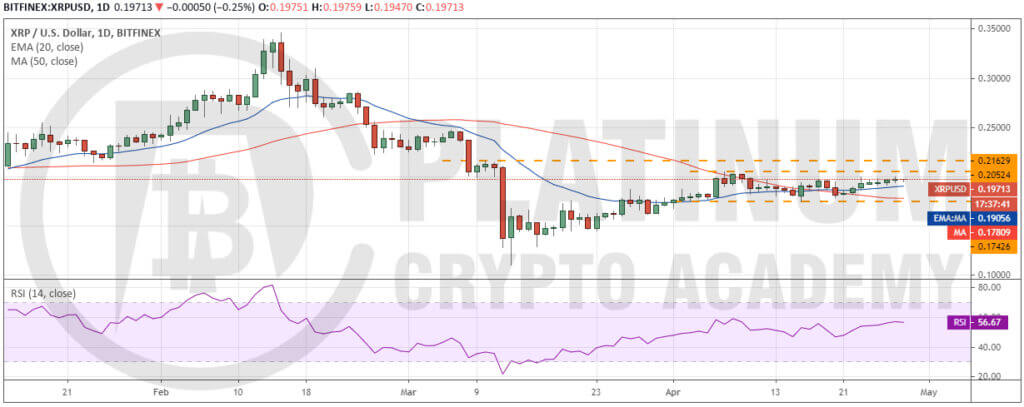
XRP remains range-bound between $0.17426-$0.20524. When the price consolidates close to the resistance of the range, it increases the possibility of a breakout.
For the past few days, the pair has been trading above the 20-day EMA. This suggests that the bulls will attempt a breakout of the overhead resistance soon.
If the bulls push the price above the $0.20524-$0.21629 resistance zone, the XRP to USD pair is likely to pick up momentum. Above this level, the next target to watch out for is $0.25. If this level is also scaled, the next target is $0.285.
On the other hand, if the price turns down from the current levels and breaks below the 20-day EMA, a drop to the bottom of the range at $0.17426 is likely. A break below the range will shift the advantage in favour of the bears.
BCH/USD
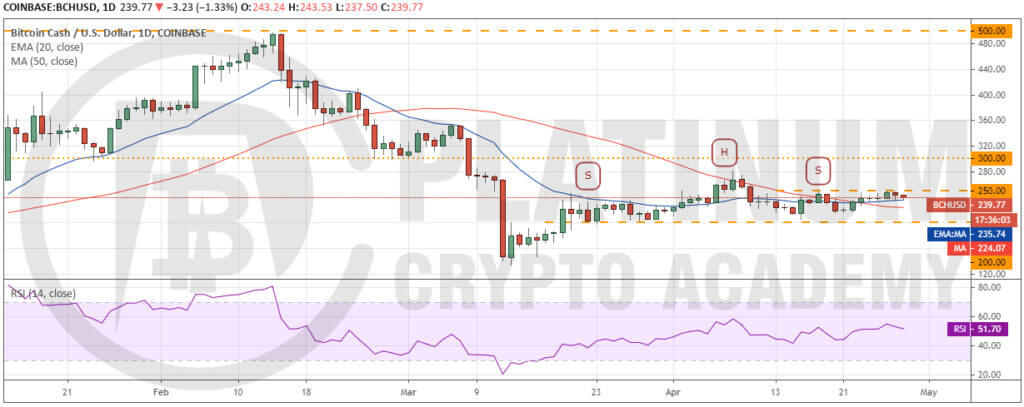
Bitcoin Cash has been trading close to $250 for the past five days. If the bulls can push the price above this resistance, a rally to $281.23 is possible. A breakout of this level will invalidate the bearish head and shoulders (H&S) pattern, which could result in a rally to $350.
Alternatively, if the price turns down from the current levels, the BCH to USD pair might extend its stay inside the $200-$250 range for a few more days. The flat 20-day EMA and the RSI close to the midpoint also suggest a few days of consolidation.
The trend will turn negative on a break below $200. Below this level, the H&S pattern will complete, which has a target objective of $118.77.
BSV/USD
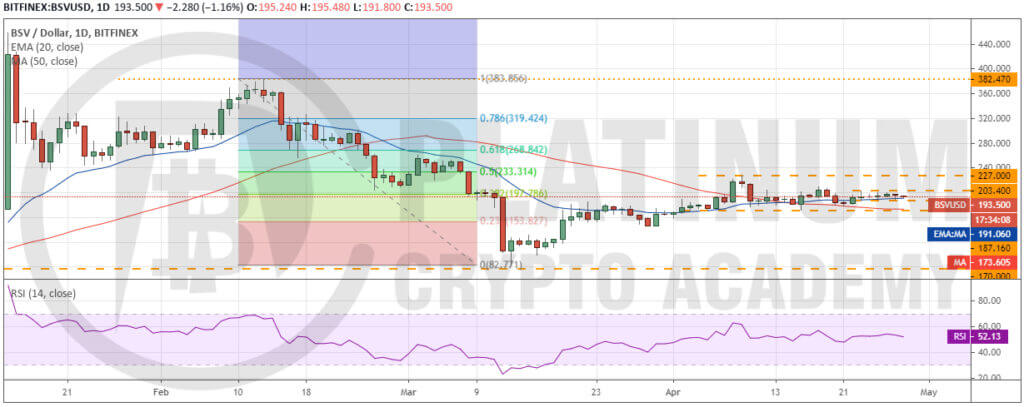
Bitcoin SV has been trading inside a tight range of $187.160-$203.40 since April 23. This suggests a balance between supply and demand. Neither the bulls nor the bears are placing any large bets as they are not confident of the next directional move.
Usually, after such a tight range trading, the breakout results in a trending move. If the bears sink the price below $187.16, a drop to $170 is possible. A break below this support will shift the advantage in favour of the bears.
Conversely, if the bulls push the price above the overhead resistance of $203.40, a move to $227 is possible. A breakout of this level will pick up momentum. The next target to watch out for is $268.842 and above it $319.424.
Hopefully, you have enjoyed today’s article. Thanks for reading!
Have a fantastic day!
Live from the Platinum Crypto Trading Floor.
Earnings Disclaimer: The information you’ll find in this article is for educational purpose only. We make no promise or guarantee of income or earnings. You have to do some work, use your best judgement and perform due diligence before using the information in this article. Your success is still up to you. Nothing in this article is intended to be professional, legal, financial and/or accounting advice. Always seek competent advice from professionals in these matters. If you break the city or other local laws, we will not be held liable for any damages you incur.
")