
Bitcoin’s rally is facing major headwinds near the $38,000 mark. Repeated failure to clear an overhead hurdle results in the start of a corrective phase. During this, buyers try to regroup at lower levels and again launch an attack at the resistance level. On the other hand, the bears try to pull the price below critical support levels and start a deeper pullback. The battle between the two is likely to increase volatility in the next few days.
Investors are ignoring the near-term uncertainty and are focusing on the two big events in 2024, Bitcoin halving in April and the Securities and Exchange Commission’s decision on spot Bitcoin exchange-traded funds in January. Crypto exchange-traded products witnessed a record inflow of $346 million in the week ending November 24, according to CoinShares data. Bitcoin ETPs attracted the lion’s share of investments at $312 million, taking the year-to-date inflows to about $1.5 billion.
Analysts considered the news of the $4.3 billion settlement between Binance, Changpeng “CZ” Zhao and the United States Department of Justice (DOJ) as a positive for the crypto space. Several analysts believe the deal has removed the roadblock and paved the way for the approval of a spot Bitcoin ETF.
PlanB, creator of the stock-to-flow family of BTC price models, believes that Bitcoin is unlikely to remain below $40,000 levels for long. Replying to a post on X (formerly Twitter), PlanB said that he expects Bitcoin to at least average above $100,000 during the 2024-2028 halving cycle.
Several long-term investors are ignoring the short-term price movements and not selling their holdings. William Clemente, co-founder of crypto research firm Reflexivity, uploaded a Glassnode chart on X, which showed that 70% of all Bitcoin in circulation had not moved in at least a year.
Will Bitcoin and major altcoins find buying support at lower levels or will the correction deepen? Let’s study the charts to find out.
BTC/USD Market Analysis
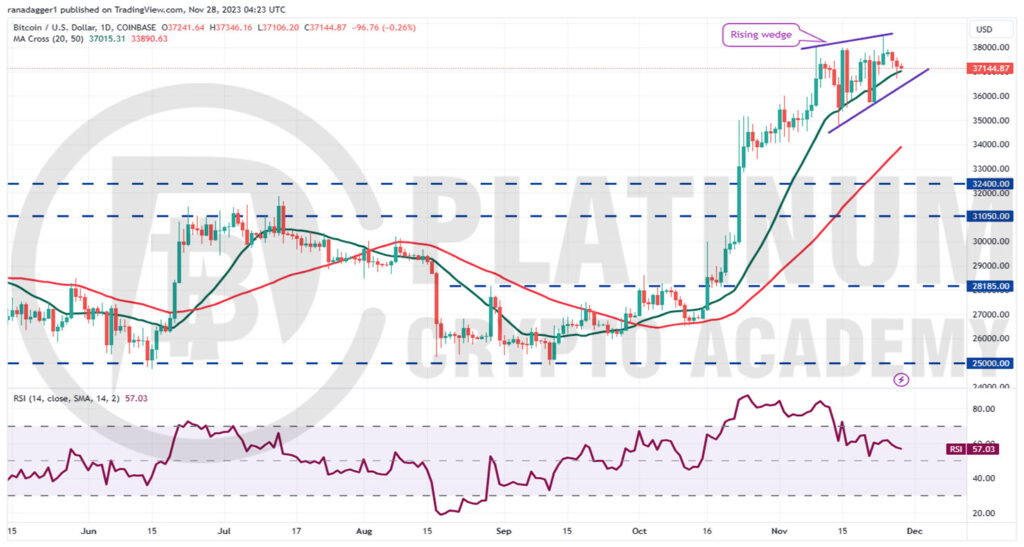
Bitcoin rose above $38,000 on November 24 but the bears sold at higher levels as seen from the long wick on the day’s candlestick. The price action of the past few days has formed a rising wedge pattern, which is considered negative if the price breaks to the downside.
The first significant support on the downside is at $34,750. If the price rebounds off this level, then the BTC/USD pair may consolidate inside the range between $34,750 and $38,000 for some time.
On the contrary, if the price slides below $34,750, it will suggest that the traders are rushing to the exit. That may start a deeper correction to the 50-day simple moving average (SMA) and then to $32,400. Buyers are expected to vigorously defend the zone between $32,400 and $31,050.
On the upside, the $38,000 remains the key level to watch out for. If the price turns up from the current level and breaks above the overhead resistance, it will signal the resumption of the uptrend. The pair may first rise to $40,000 and thereafter sprint toward the next major hurdle at $48,000.
ETH/USD Market Analysis
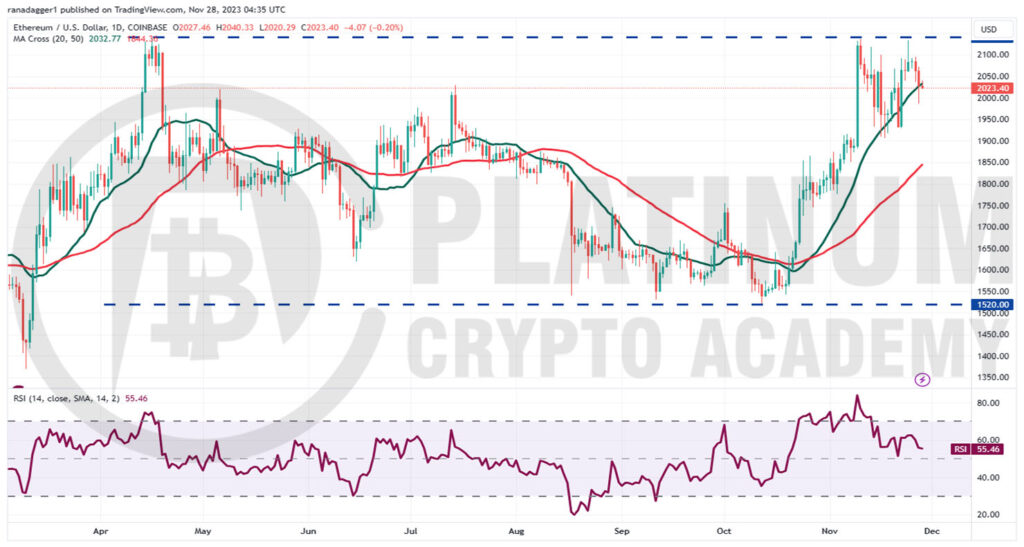
We said in the previous analysis that a break below $2,030 would sink Ether to the 20-day SMA and that is what happened. Lower levels attracted strong buying by the bulls but the bulls could not overcome the obstacle at $2,142.
This suggests that the ETH/USD pair may remain stuck inside the $1,900 to $2,142 range for some time. Although the upsloping moving averages suggest an advantage to buyers, the RSI near 55 indicates that the bullish momentum is slowing down.
If the price sustains below the 20-day SMA, the bears will try to strengthen their position and sink the pair below $1,900. If they do that, the pair may slump to the 50-day SMA and later to $1,750.
Contrarily, if the price turns up and breaks above $2,142, it will indicate the start of a new uptrend. The pair may rise to $2,516 and subsequently to $2,950.
BNB/USD Market Analysis
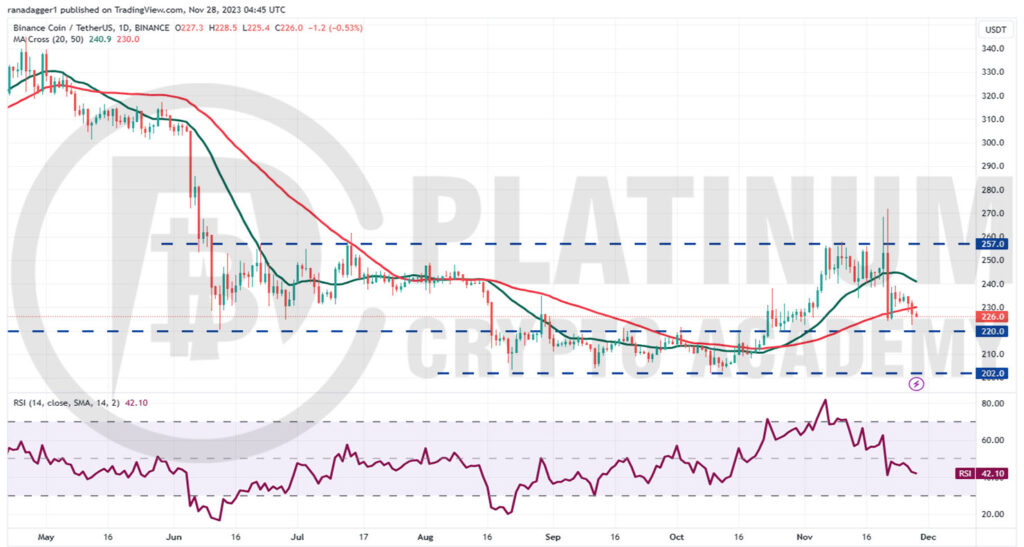
Binance Coin has been all over the place in the past few days. Buyers pushed the price above the overhead resistance of $257 on November 20 and 21 but could not maintain the higher levels as seen from the long wick on the candlesticks.
The failure to do so may have tempted short-term traders to book profits. That pulled the price back below the 20-day SMA on November 21. The bulls tried to start a recovery on November 22, but that was short-lived. This suggests that the bears are trying to establish their supremacy.
The 20-day SMA has started to turn down and the RSI is in the negative territory, indicating that bears have the edge. If the price slumps below $220, the decline could extend to $202. This level may witness aggressive buying by the bulls.
If bulls want to prevent the sharp fall, they will have to fiercely protect the $220 level. A strong rebound off this level will increase the likelihood of a range-bound action between $220 and $257.
XRP/USD Market Analysis
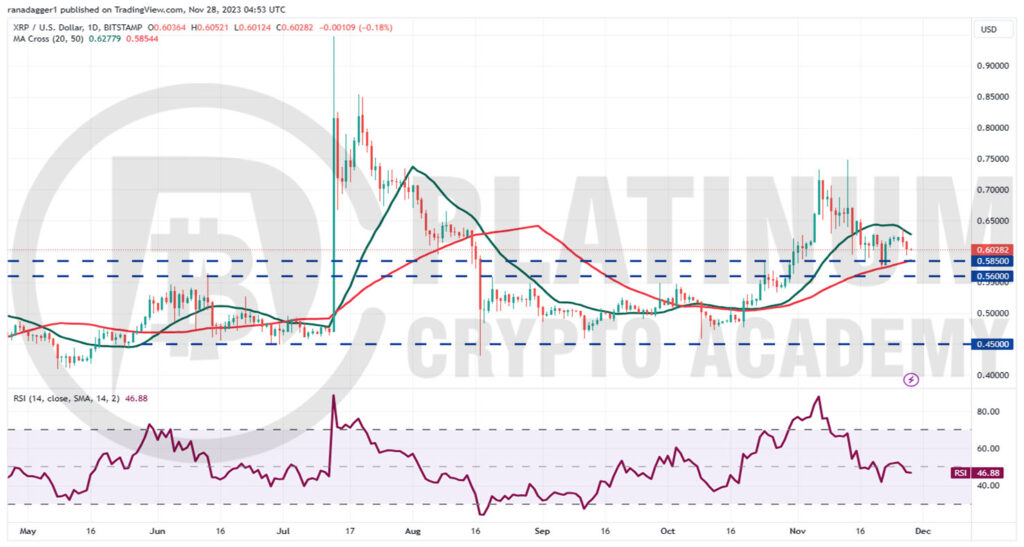
We mentioned in the previous analysis that the price will dip to the 20-day SMA and if that support cracks, XRP may plummet to the 50-day SMA and that is how it played out.
The price bounced off the 50-day SMA on November 22 but the bulls are struggling to shove the price above the 20-day SMA. This suggests that the sentiment has turned negative and traders are selling on rallies.
The bears will try to sink the price below the $0.58 to $0.56 zone. If they manage to do that, it will suggest an advantage to sellers. The XRP/USD pair could then start a steeper correction to $0.45.
Contrarily, if the price turns up from the current level and rises above the 20-day EMA, it will indicate that the bulls are defending the support at $0.56 with vigor. That could open the doors for a potential rally to $0.75.
ADA/USD Market Analysis
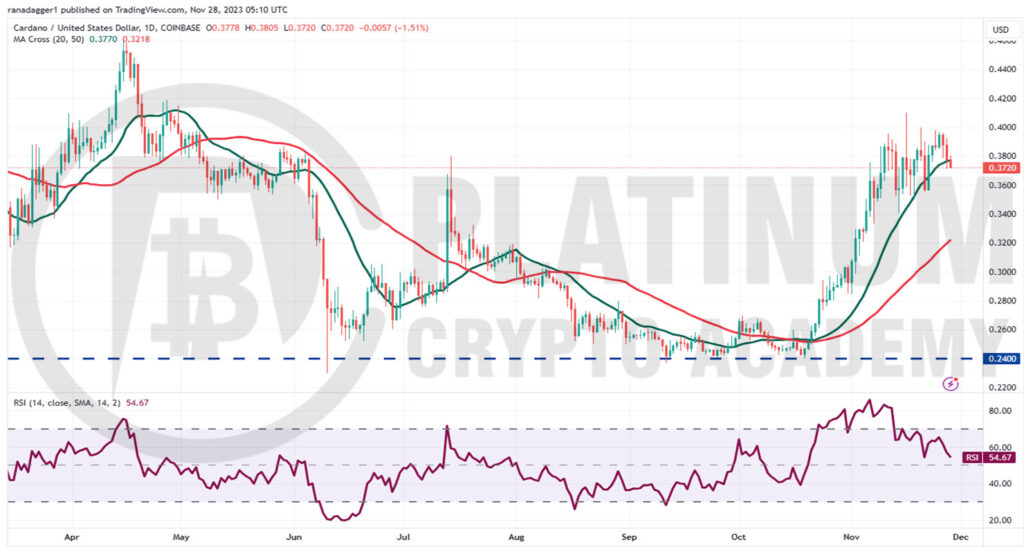
Cardano has been stuck between the 20-day SMA and $0.40 for the past few days, but this tight-range trading is unlikely to continue for long. The repeated failure to overcome the obstacle at $0.40 may tempt short-term bulls to book profits. That could sink the price below the 20-day SMA, opening the doors for a fall to $0.34.
If bulls want to maintain the positive momentum, they will have to defend the $0.34 level with vigor. If they do that, the ADA/USDT pair may rise toward $0.40. A break and close above this resistance will start the next leg of the up-move to $0.46.
Meanwhile, the bears are likely to have other plans. They will try to yank the price below $0.34 and start a correction to the 50-day SMA. This is an essential level for the bulls to defend because a break below it may drag the pair to $0.28.
Hopefully, you have enjoyed today’s article for further coverage please check out our crypto Blog Page. Thanks for reading! Have a fantastic day! Live from the Platinum Crypto Trading Floor.
Earnings Disclaimer: The information you’ll find in this article is for educational purpose only. We make no promise or guarantee of income or earnings. You have to do some work, use your best judgement and perform due diligence before using the information in this article. Your success is still up to you. Nothing in this article is intended to be professional, legal, financial and/or accounting advice. Always seek competent advice from professionals in these matters. If you break the city or other local laws, we will not be held liable for any damages you incur.
