
Bitcoin has been all over the place in the past few days. It rose to a new lifetime high of $73,835 on March 14 but then quickly gave back its gains and plummeted to $64,774 on March 16. This shows that some traders may have booked profits after the recent leg of the rally. Will Bitcoin’s price pick up and soar to a new all-time high again, or is it time for a correction? That’s the question in every trader’s mind.
The sentiment in the cryptocurrency sector received a boost following strong inflows into the spot Bitcoin exchange-traded funds, and that remains intact. CoinShares data shows record inflows of $2.9 billion into digital asset investment products last week. That pushed the year-to-date inflows to $13.2 billion, overtaking the 2021 full-year inflows of $10.6 billion.
The Bitcoin ETFs were expected to boost institutional investment, but that doesn’t seem to be the case. The average trade size of 326 shares or around $13,000 in BlackRock’s iShares Bitcoin Fund (IBIT) suggests that the trades were done by nonprofessional investors, according to Bloomberg Intelligence senior ETF analyst Eric Balchunas.
In a recent note, Standard Chartered’s Geoff Kendrick said that growing interest from reserve managers and possible support from FX reserves could boost investment into Bitcoin ETFs. If the inflows remain strong, Kendrick expects Bitcoin to soar to $150,000 in 2024 and continue the rally in 2025 to hit 250,000.
This shows the analysts remain upbeat for the long term. However, they will closely monitor the inflows because a slowdown could hurt sentiment and tempt traders to book profits.
Bitcoin has historically pulled back 14 to 28 days leading up to its halving. Bitcoin plunged 40% in 2016 and a much shallower 20% in 2020. If history repeats itself, then Bitcoin could face near-term weakness.
What are the important support levels to watch out for in Bitcoin and the major altcoins? Let’s study the charts to find out.
BTC/USD Market Analysis
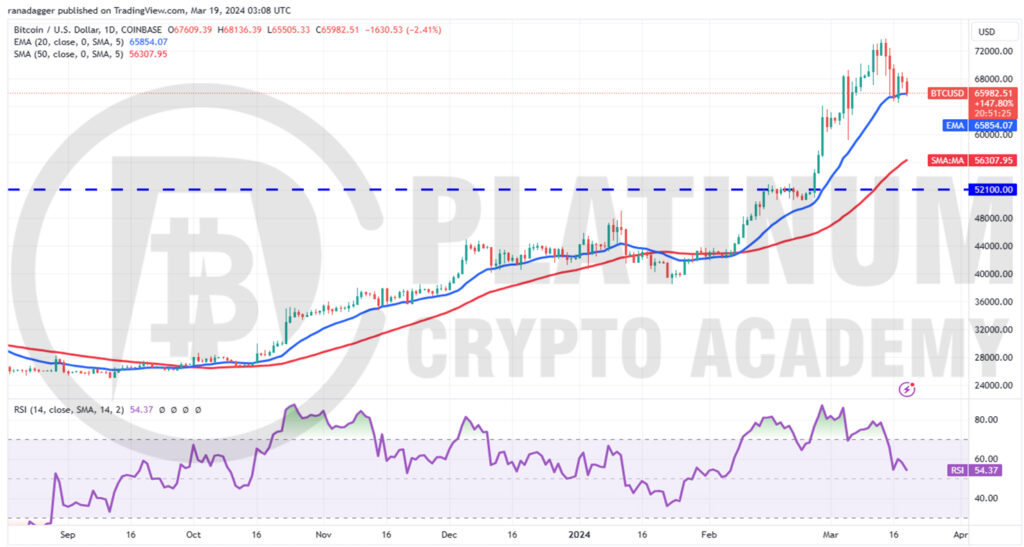
We cautioned readers in the previous analysis that vertical rallies are rarely sustainable and are usually followed by sharp declines. Bitcoin surged to $73,835 on March 14 but then nosedived to $64,774 on March 16.
The bulls are attempting to defend the 20-day exponential moving average (EMA), but the shallow bounce off it suggests that the bears are selling on every minor rally.
If the BTC/USD pair breaks and closes below the 20-day EMA, it may trigger the stops of several short-term traders. The pair could then drop to $59,224 and later to the 50-day simple moving average (SMA). Buyers are expected to defend the 50-day SMA with vigor. The pair may enter a few days of consolidation before starting a trending move.
On the upside, if the price rises above $69,000, it will suggest that the corrective phase may be over. The pair could jump to the all-time high at $73,835. If this level is scaled, the pair could rise to $80,000. However, we give it a low possibility of occurring in the near term.
ETH/USD Market Analysis
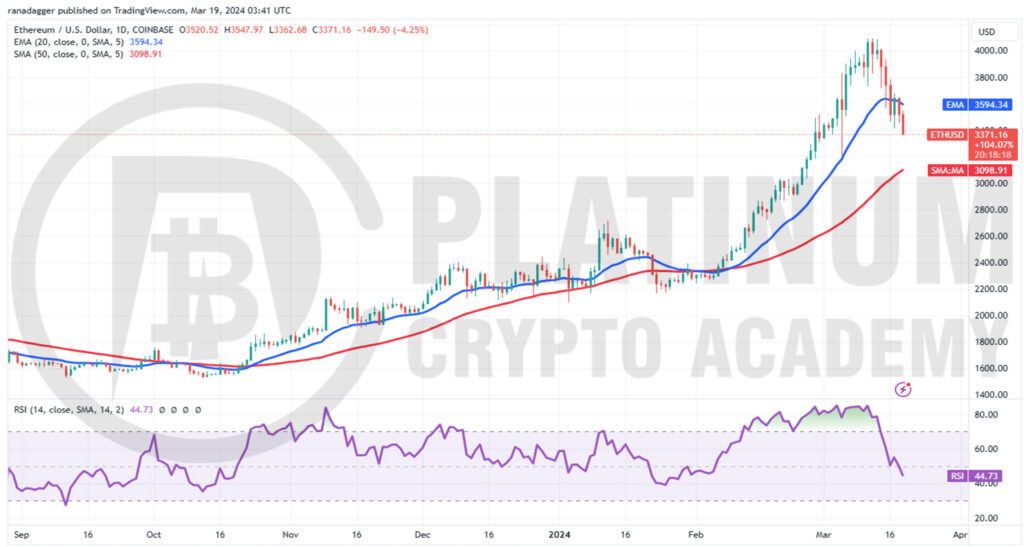
We said in the earlier analysis that Ether’s rally was looking stretched in the near term, and a correction was possible, and that is how it played out.
After failing to break above $4,100, the ETH/USD pair started its decline on March 14 and fell below the 20-day EMA on March 16. The bulls tried to push the price back above the 20-day EMA on March 17, but the bears held their ground. This suggests that the bears are trying to sell on rallies to strong overhead resistance levels.
The 20-day EMA has started to turn down, and the RSI has slipped into the negative territory, indicating a minor advantage for the bears. The pair could plunge to the 50-day SMA, where the buyers are likely to step in. Any recovery attempt is expected to face strong selling at the 20-day EMA.
This bearish view will be negated in the near term if the price turns up and rises above $3,700. Such a move will suggest solid buying at lower levels. The pair may then climb toward the overhead resistance of $4,100.
BNB/USD Market Analysis
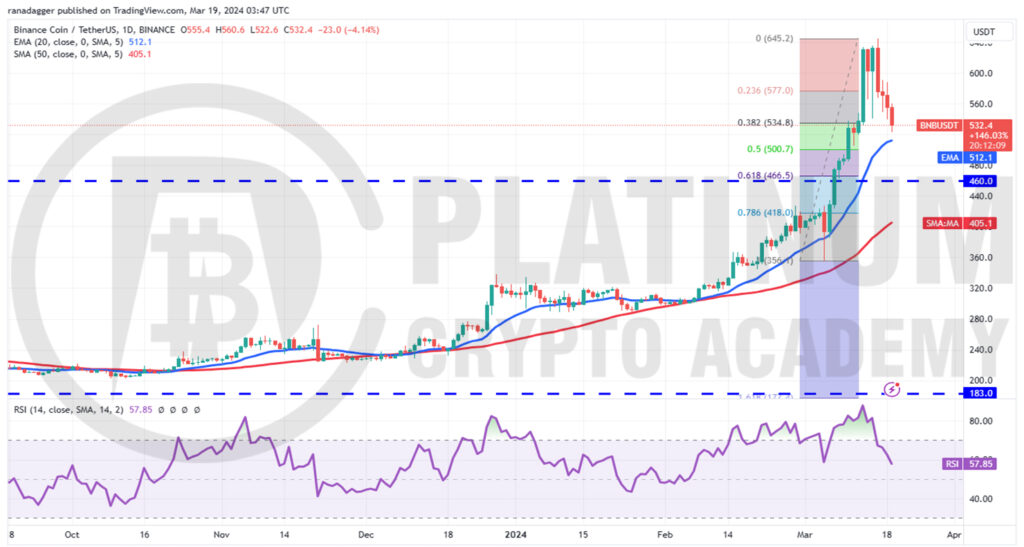
Binance Coin has been in a solid uptrend for several days. The momentum picked up after buyers pushed the price above $460 on March 7. The up move pushed the RSI deep into the overbought territory, indicating that the rally was overextended in the near term.
Traders booked profits near $645 on March 16, starting a pullback toward the 20-day EMA. The bulls and the bears are likely to engage in an intense battle near the 20-day EMA.
If the price rebounds off the 20-day EMA, the BNB/USD pair could rise toward $645 and remain range-bound between these two levels for a few days. A break above $645 will signal the resumption of the uptrend toward $692.
On the other hand, a slide below the 20-day EMA may accelerate selling, and the pair could tumble to $460, which is an important support to watch out for. A strong bounce off this level could keep the pair range-bound for some time.
XRP/USD Market Analysis
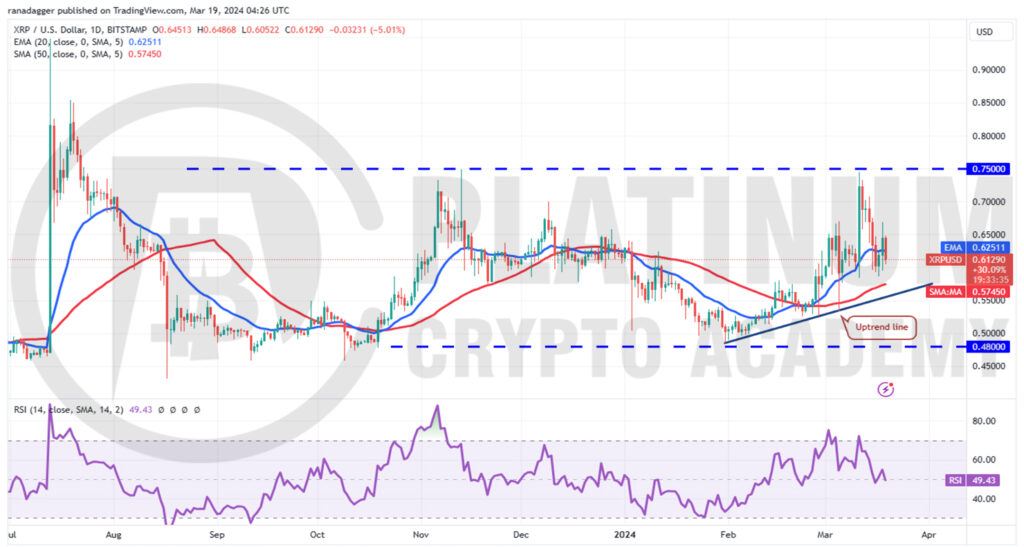
XRP skyrocketed from the 20-day EMA on March 11 and reached the overhead resistance of $0.75, but the bulls could not overcome this obstacle. This suggests that the bears are active at higher levels.
The price turned down from $0.75 and broke below the 20-day EMA on March 16. This suggests that the pair may continue to swing between $0.48 and $0.75 for some more time.
The flattening 20-day EMA and the RSI near the midpoint do not give a clear advantage either to the bulls or the bears.
If the price skids below the uptrend line, the selling could pick up, and the pair may drop to $0.48. Contrarily, if the price rises above $0.67, the advantage will tilt in favor of the bulls. The pair could then attempt a rally to $0.75. A break and close above $0.75 could start a new uptrend toward $0.95.
ADA/USD Market Analysis
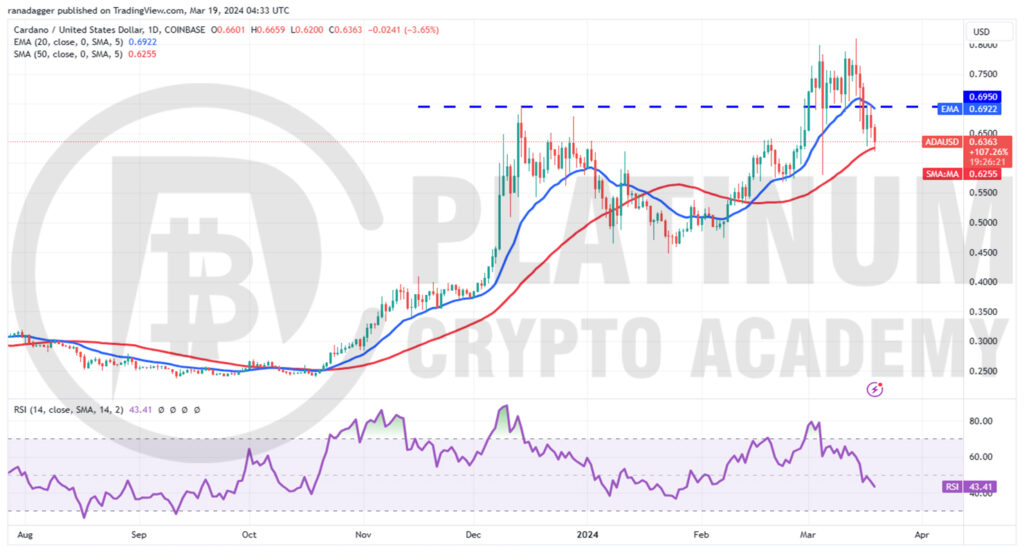
We mentioned in the previous analysis that a break below the 20-day EMA could pull Cardano to the 50-day SMA, and that is what happened.
The 20-day EMA has started to turn down, and the RSI is in the negative zone, suggesting that bears have the upper hand. If the 50-day SMA gives way, the ADA/USD pair could collapse to $0.56. The bulls are likely to defend this level with vigor.
Contrary to this assumption, if the price rebounds off the 50-day SMA, it will suggest demand at lower levels. Any recovery attempt is likely to face selling at the 20-day EMA. If the price turns down from the 20-day EMA, it will increase the likelihood of a break below the 50-day SMA.
If bulls want to make a comeback, they will have to push and maintain the price above $0.70. The pair could then rally to $0.80.
Hopefully, you have enjoyed today’s article for further coverage please check out our crypto Blog Page. Thanks for reading! Have a fantastic day! Live from the Platinum Crypto Trading Floor.
Earnings Disclaimer: The information you’ll find in this article is for educational purpose only. We make no promise or guarantee of income or earnings. You have to do some work, use your best judgement and perform due diligence before using the information in this article. Your success is still up to you. Nothing in this article is intended to be professional, legal, financial and/or accounting advice. Always seek competent advice from professionals in these matters. If you break the city or other local laws, we will not be held liable for any damages you incur.
