
Bitcoin soared on August 29 on reports that crypto asset manager Grayscale had won its lawsuit against the United States Securities and Exchange Commission (SEC) for converting its over-the-counter Grayscale Bitcoin Trust into a listed spot Bitcoin exchange-traded fund. However, the euphoria was short-lived as analysts cautioned that the victory did not mean a listing of the Grayscale spot Bitcoin ETF was certain.
The sentiment soured further after the SEC delayed its decision on all pending Bitcoin spot ETF applications on August 31. That meant the deadline was pushed forward by the SEC to October 17. This news pulled Bitcoin back into the range.
However, analysts have remained positive on the prospects of a spot Bitcoin ETF getting eventual approval. JPMorgan analysts said in a recent report that the SEC was likely to approve a Bitcoin ETF from several asset managers.
Though analysts are divided on the impact of a Bitcoin ETF on crypto prices, such an approval will reduce regulatory uncertainty. That is likely to increase flows from institutional investors who have been sitting on the sidelines due to a lack of clarity on regulations.
Although the crypto news flow has been positive, seasonal factors do not support a bullish revival in September. CoinGlass data shows that September has generally favored the bears. Since 2013, Bitcoin has risen in September only on two occasions, way back in 2015 and 2016. For the past six years, Bitcoin has repeatedly closed in the red in September. But a minor sign of relief for the bulls is that October has produced sharp rallies.
Another positive sign is that large Bitcoin holders have continued to accumulate Bitcoin during the current period of lull. Market intelligence platform IntoTheBlock said in a recent report that “addresses holding 0.1% of the Bitcoin supply or more have added over $1.5 billion in BTC holdings in the last two weeks.”
Could Bitcoin break out of its slumber and lead a recovery in the cryptocurrency markets? Let’s study the charts of Bitcoin and the major altcoins to find out.
BTC/USD Market Analysis
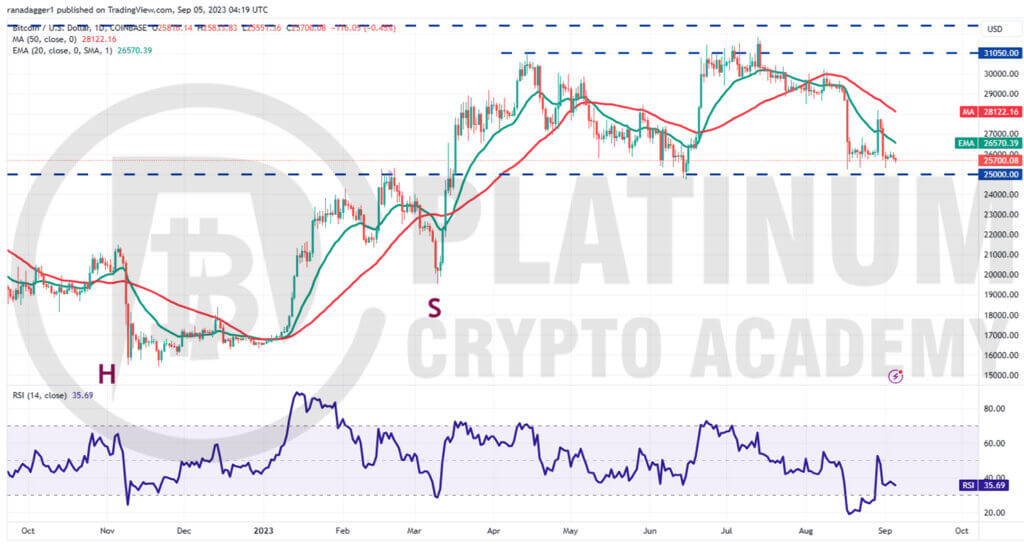
We said in the previous analysis that the oversold levels on the RSI suggest a recovery or consolidation is possible and that is what happened. Bitcoin soared above the 20-day exponential moving average (EMA) on August 29.
A minor negative is that the bulls could not sustain the higher levels. This suggests that the bears view the rallies as a selling opportunity. The price plunged back below the 20-day EMA on August 31.
Since then, the BTC/USD pair has been trading inside a small range, indicating a lack of aggressive buying or selling by the traders. The downsloping moving averages and the relative strength index (RSI) in the negative territory indicate that bears are in command.
The sellers will attempt to sink the price below $25,000 but the bulls are expected to defend this level with all their might. A strong bounce off this support will indicate that the $31,050 to $25,000 range remains intact.
On the contrary, a break and close below $25,000 will signal the start of a deeper correction. There is a minor support at $24,000 but that is likely to be broken. The pair could then plunge to the crucial support at $20,000.
On the upside, the moving averages will act as a major hurdle. The bulls will have to propel the price above $28,185 to indicate the start of a relief rally toward $31,050.
ETH/USD Market Analysis
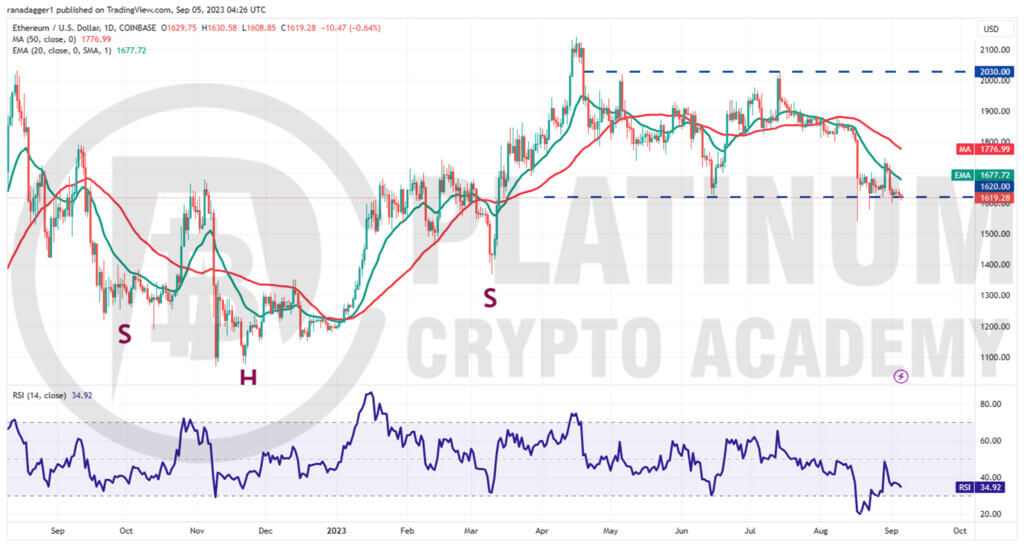
Ether rose above the 20-day EMA on August 29 but the bulls could not sustain the higher levels. This suggests that the sentiment remains negative and traders are selling on rallies.
The price has been trading near the critical support at $1,620 for the past few days. This suggests a tough battle between the bulls and the bears to gain supremacy.
A minor negative is that the bulls have not been able to start a strong rebound off the current level. This increases the likelihood of a drop below $1,620. If that happens, the ETH/USD pair could retest the August 17 intraday low of $1,540.
If this support cracks, the selling could intensify and the pair may nosedive to the next major support at $1,369. If buyers want to prevent the decline, they will have to quickly shove the price above the 50-day SMA. That could open the doors for a potential rally to $1,900.
BNB/USD Market Analysis
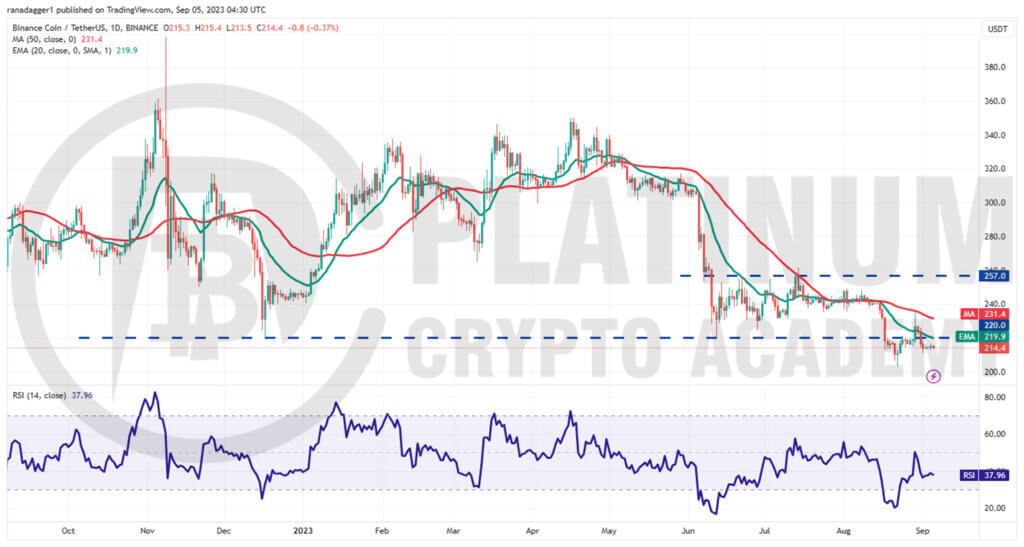
We mentioned that $200 is an important support to watch out for and if buyers kick the price above $220, a rally to $235 is possible. Both these things played out perfectly.
Binance Coin turned up from $203.40 on August 22 and reached $234.80 on August 29.
The bears sold the relief rally to the 50-day simple moving average and yanked the price back below $220 on August 31. This indicates that the BNB/USD pair remains in a firm bear grip.
The $200 level remains the key downside support to watch out for. If this level gives way, the pair may slide to the next major support at $183.
This negative view will invalidate in the near term if bulls thrust and sustain the price above the moving averages. That could clear the path for a recovery to $257.
XRP/USD Market Analysis
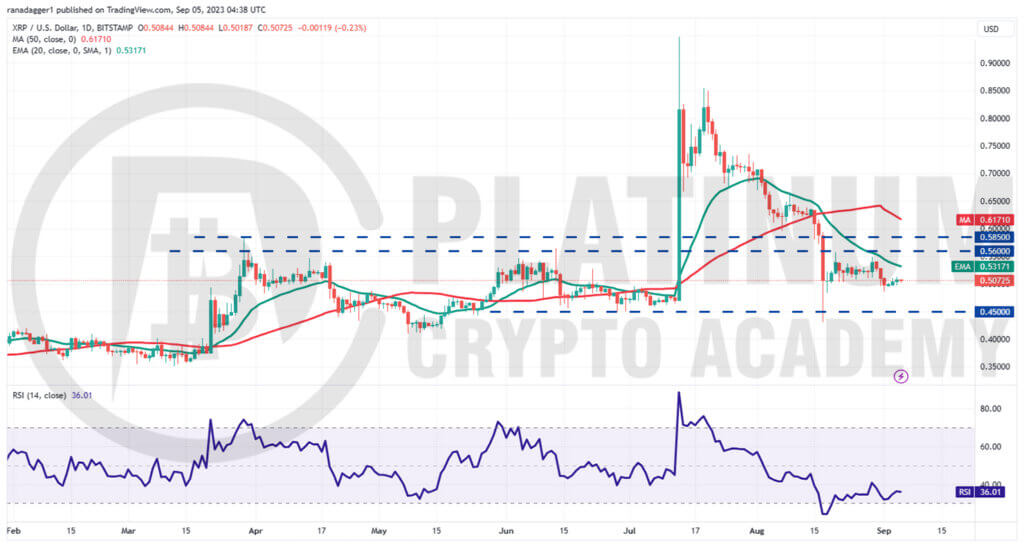
We said in our previous analysis that XRP could swing between $0.45 and $0.58 for a few days and that is what is happening. The price turned down from the 20-day EMA on August 30 signaling that bears remain in command.
Sellers will try to build upon their advantage and sink the XRP/USD pair to the vital support at $0.45. This level is likely to attract huge buying by the bulls. If the price rebounds off this support with strength, it will indicate that the range-bound action may continue for some more time.
A break above or below the range could start the next trending move but it is difficult to predict the direction of the breakout with certainty. If the $0.45 support cracks, the pair could tumble to $0.40.
On the upside, a break and close above $0.58 could open the gates for a potential rally to $0.65.
ADA/USD Market Analysis
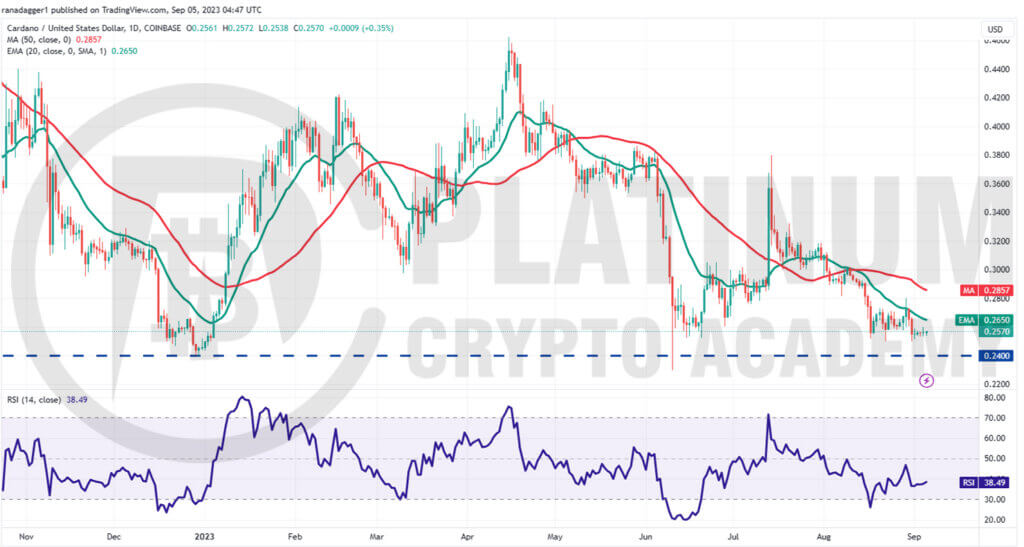
We mentioned in our previous analysis that bears have the upper hand and they proved it right on August 29. The bulls tried to kick and sustain the price above the 20-day EMA but the bears held their ground.
That started a downward move toward the immediate support at $0.25. Buyers have successfully defended this level but a minor negative is that they haven’t been able to start a strong rebound off it.
The bears will try to latch on to this opportunity and tug the price below $0.25. The ADA/USD pair could then retest the pivotal support at $0.24. If this level crumbles, the pair could slide to $0.22.
Buyers will gain strength if they drive the price above the 50-day SMA. That could push the price toward $0.32.
Hopefully, you have enjoyed today’s article for further coverage please check out our crypto Blog Page. Thanks for reading! Have a fantastic day! Live from the Platinum Crypto Trading Floor.
Earnings Disclaimer: The information you’ll find in this article is for educational purpose only. We make no promise or guarantee of income or earnings. You have to do some work, use your best judgement and perform due diligence before using the information in this article. Your success is still up to you. Nothing in this article is intended to be professional, legal, financial and/or accounting advice. Always seek competent advice from professionals in these matters. If you break the city or other local laws, we will not be held liable for any damages you incur.
