
Bitcoin has been in a consolidation for the past several weeks. Though September has been a historically weak month for Bitcoin, buyers held their ground and did not allow the price to collapse. According to CoinGlass data, Bitcoin recorded its third positive monthly close for September since 2013, with a 3.91% rise. This will help boost investor sentiment and lay the stage for October.
Historical data shows that October favors the bulls. There have been only two negative monthly closes in October, in 2014 and again in 2018. Due to October’s bullish record, it is also affectionately called “Uptober.” True to its name, Bitcoin started October with a bang and rose above $28,500 in the first two days. The up-move may have also been supported by the news that the United States Congress passed a last minute deal to avoid a government shutdown on September 30.
While several traders are concerned about Bitcoin’s short-term price action, the long-term investors remain unperturbed. Software intelligence firm MicroStrategy said in its regulatory filing that it has acquired roughly 5,445 Bitcoin for $147.3 million. This takes MicroStrategy’s total haul to 158,245 Bitcoin, purchased at an average price of $29,582 per Bitcoin.
Although the sentiment remains positive, it is unlikely to be a one-way journey for the cryptocurrency markets. Bitcoin generally moves in inverse correlation with the US dollar and the greenback has been on a tear for the past several days. The US dollar index (DXY) has risen to its highest level year-to-date and is showing no signs of slowing down. This may put the brakes on the crypto rally in the near term.
Another hurdle to the crypto rally is likely to come from the high interest rate environment. The Federal Reserve dashed hopes when it cut the forecast for rate cuts in 2024 from four to two, indicating that rates were likely to remain higher for longer. High interest rates are not conducive for risky assets.
What are the important support and resistance levels to watch out for on Bitcoin and the major altcoins? Let’s study their charts to find out.
BTC/USD Market Analysis
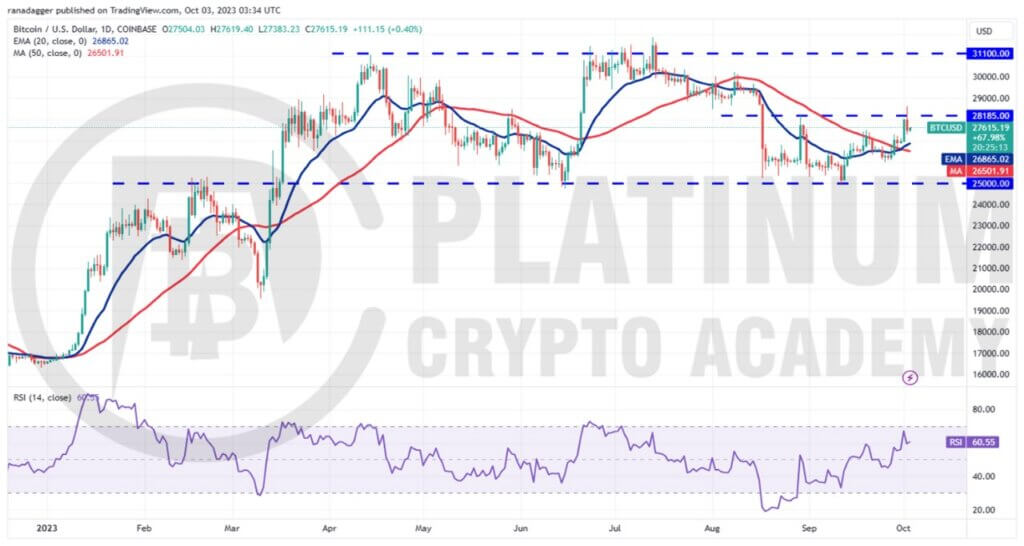
We said in the previous analysis that the bulls are trying to flip the 20-day exponential moving average (EMA) into support and if they do that, Bitcoin could climb to the 50-day simple moving average (SMA) and later to $28,185 and that is what happened
The bulls pushed the price above $28,185 on October 2 but the long wick on the candlestick shows aggressive selling by the bears. The sellers are trying to keep the BTC/USD pair inside the range between $28,185 and $25,000 but the bulls are likely to have other plans.
The rising 20-day EMA and the relative strength index (RSI) in the positive territory indicate that bulls have the upper hand. If the price rebounds off the 20-day EMA, it will signal that the sentiment remains positive. That will enhance the prospects of a break above $28,185. If that happens, the pair may attempt a rally to $30,000 and then to $31,000.
Contrary to this assumption, if the bears sink the price below the 20-day EMA, it will suggest that the range remains in force. In a range, traders generally buy near the support and sell at the resistance. The bears will have to sink and sustain the price below $25,000 to gain the upper hand.
ETH/USD Market Analysis
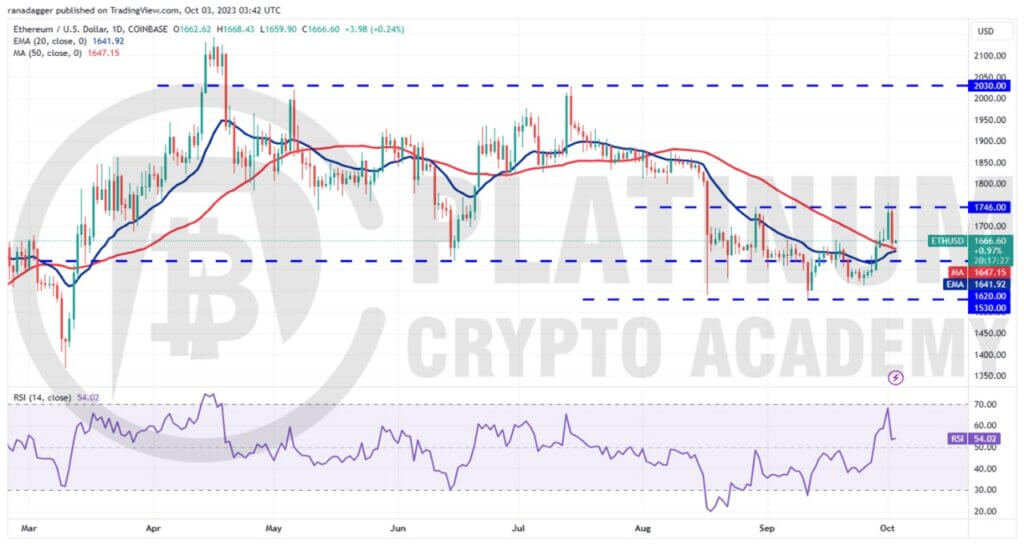
We suggested in the previous analysis that if bulls push the price above the 20-day EMA, Ether could soar to $1,746 and that is how it played out. Buyers propelled the price above the 20-day EMA on September 28 and the ETH/USD pair reached $1,746 on October 1.
However, the sharp reversal from $1,746 on October 2 shows that the bears are unlikely to give up without a fight. The bulls are trying to arrest the pullback at the 20-day EMA. If the price rebounds off the current level, the buyers will make one more attempt to push the price above $1,746.
If they can pull it off, it will signal the formation of a potential double bottom pattern. This bullish setup has a target objective of $1,962.
Contrarily, if the price dips below the 20-day EMA, it will suggest a lack of buyers on dips. That will increase the possibility of the pair remaining inside the $1,530 to $1,785 range for some more time.
BNB/USD Market Analysis
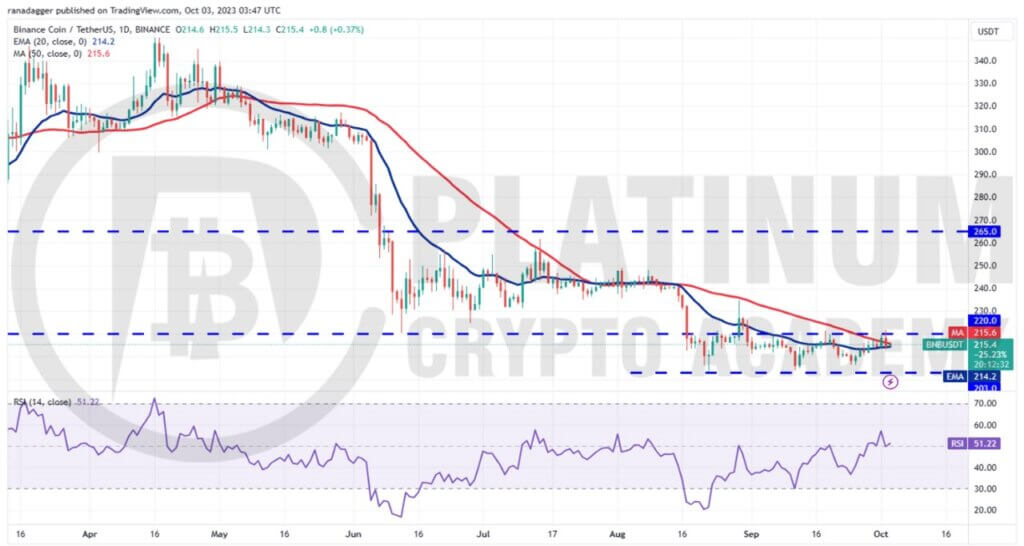
Binance Coin has been oscillating between $203 and $220 for the past few days. The bulls tried to shove the price above $220 on October 2 but the bears held their ground.
A minor positive in favor of the buyers is that they have not allowed the price to dip back below the 20-day EMA. This suggests that the bulls are trying to flip the 20-day EMA into support.
If they manage to do that, the likelihood of a rally above $220 increases. The BNB/USD pair could first rally to $235 and thereafter attempt a rally to $257. This level is again likely to pose a strong challenge to the bulls.
On the contrary, if the price slips below the 20-day EMA, it will suggest that the bulls have given up. The price may then descend to the strong support at $203. Buyers are expected to defend this level with all their might because a break below it could sink the pair to $183.
XRP/USD Market Analysis
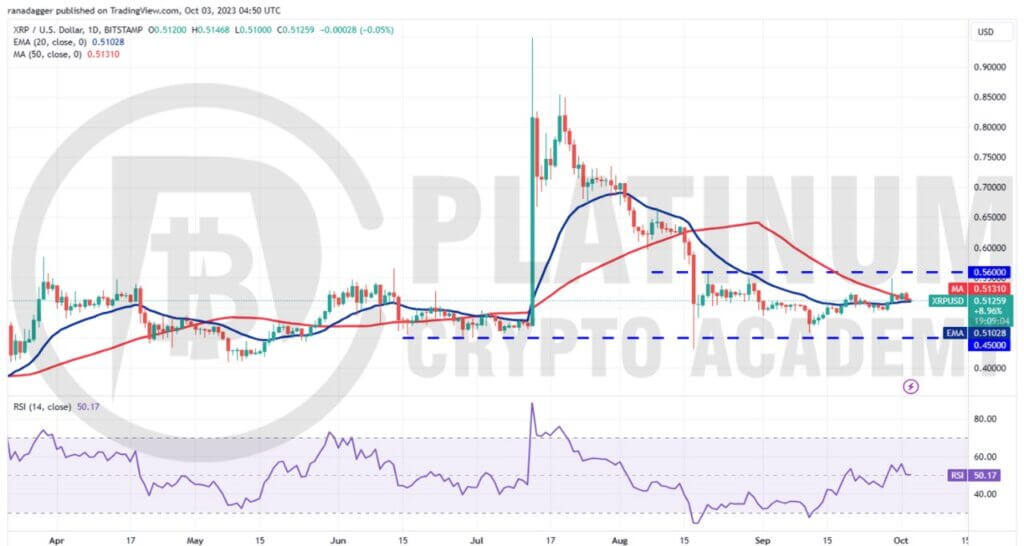
We said in the last analysis that if bulls overcome the obstacle at the 20-day EMA, XRP could rally to $0.56 and that is what it did. We also said that $0.56 is likely to act as a roadblock and it did just that.
The long wick on the September 29 candlestick shows that the bears are defending the $0.56 level. The 20-day EMA is flattish and the RSI is near the midpoint, indicating a balance between supply and demand. This points to a consolidation between $0.45 and $0.56 in the near term.
If bulls want to come out on top, they will have to thrust the price above $0.56. If they succeed, the pair is likely to start an up-move to $0.67. On the other hand, a break and close below the $0.45 support will signal the start of a downtrend. The pair could then slump to $0.40.
ADA/USD Market Analysis
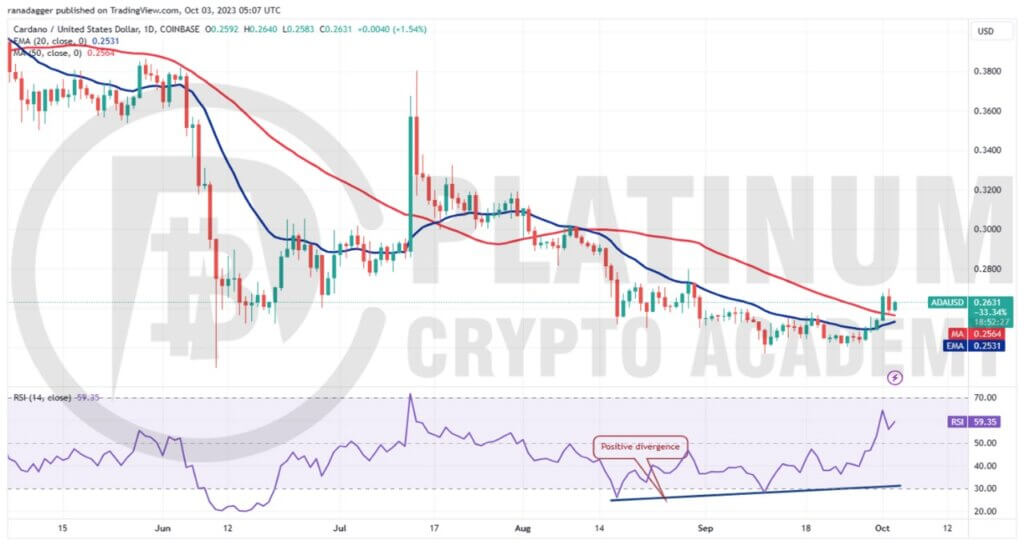
We mentioned in our previous analysis that the positive divergence on the RSI suggests that the ADA could rise above the 20-day EMA and that is how it unfolded.
The 20-day EMA has started to turn up slowly and the RSI has jumped into the positive zone, indicating that bulls are trying to seize control. Buyers will try to kick the price to $0.28 which is an important level to watch out for.
If the price sharply turns down from $0.28, the ADA/USD pair could again dip to $0.24 and stay range-bound for a while longer.
Alternatively, if bulls overcome the barrier at $0.28, it will suggest the start of a sustained recovery. The pair may then soar to $0.32. On the downside, a break and close below $0.24 will open the doors for a decline to $0.22.
Hopefully, you have enjoyed today’s article for further coverage please check out our crypto Blog Page. Thanks for reading! Have a fantastic day! Live from the Platinum Crypto Trading Floor.
Earnings Disclaimer: The information you’ll find in this article is for educational purpose only. We make no promise or guarantee of income or earnings. You have to do some work, use your best judgement and perform due diligence before using the information in this article. Your success is still up to you. Nothing in this article is intended to be professional, legal, financial and/or accounting advice. Always seek competent advice from professionals in these matters. If you break the city or other local laws, we will not be held liable for any damages you incur.
