
Bitcoin’s recovery above $24,000 faltered on July 21 on the news that Tesla had dumped 75% of its Bitcoin holdings in the second quarter of this year. Although the electric carmaker did not reveal the sale price, analysts estimate the price to be around $29,000 per Bitcoin. The sale was in contradiction to the company’s CEO Elon Musk who said in May 2021 that Tesla did not plan to sell any of its Bitcoin.
Tesla is not the only institutional investor which has sold its Bitcoin holdings. According to Vetle Lunde, research analyst at Arcane Research, institutional investors have sold 236,237 Bitcoin since May 10 of this year. While some of the selling was forced, others were not. The selling started with the Luna Foundation Guard dumping more than 80,000 of its Bitcoin reserve to save the peg on stablecoin UST. That was followed by further selling from the crisis-hit crypto lending firm Celsius and the crypto hedge fund Three Arrows Capital.
The retail traders seem to be absorbing some of the selling by institutional investors. Citing Glassnode data, the Twitter account Documenting Bitcoin said that the “number of entities with less than one Bitcoin price have been growing!”
JPMorgan Chase & Co. said in a recent report that retail demand was increasing in the crypto markets and the “intense phase” of deleveraging may be over. The bank highlighted that “smaller wallets have seen an increase in ether or bitcoin balances since the end of June at the expense of larger holders,” CoinDesk reported.
The near-term price action may be hinged on the key Federal Reserve meeting on July 26-27. Traders are anticipating a 75 basis-point rate hike but all eyes will be on the outlook going forward.
Bitcoin and the major altcoins may remain volatile in the near term. Are the dips a buying opportunity? Read our analysis on how higher interest rates by Fed rate hikes could play out at the bottom in crypto markets.
BTC/USD Market Analysis
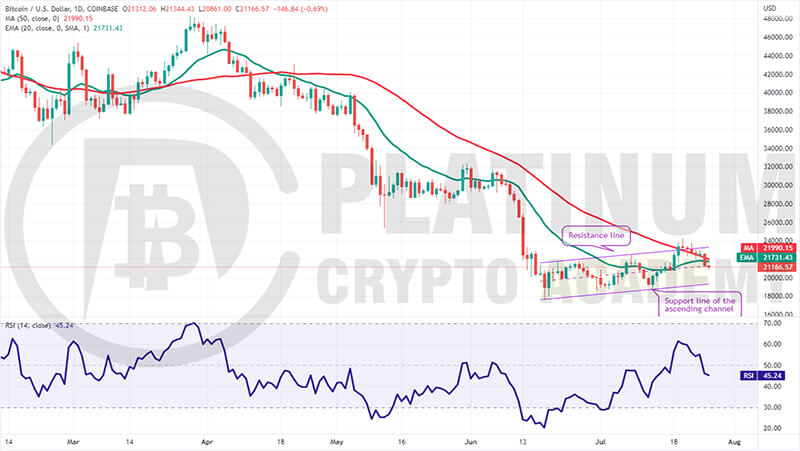
Bitcoin broke above the ascending channel and the 50-day simple moving average (SMA) on July 19 but the bulls could not build upon this advantage. The long wick on the July 20 candlestick shows selling above $24,000.
The bears pulled the price back into the channel on July 21 and thwarted attempts by the bulls to resume the recovery on July 22. The buyers made one more attempt to clear the channel on July 24 but failed.
This may have tempted short-term traders to book profits. That pulled the price back below the 20-day exponential moving average (EMA) on July 25. This move suggests that the BTC/USD pair may spend some more time inside the channel.
The flattish 20-day EMA and the relative strength index (RSI) just below the midpoint indicate a balance between supply and demand.
If the price slips below the $20,450 to $20,750 support zone, the decline could extend to the support line of the channel. This level is likely to attract strong buying from the bulls.
On the upside, the bulls will have to clear the overhead resistance at $24,300 to signal the start of a new up-move. The pair could then climb toward $30,000.
ETH/USD Market Analysis
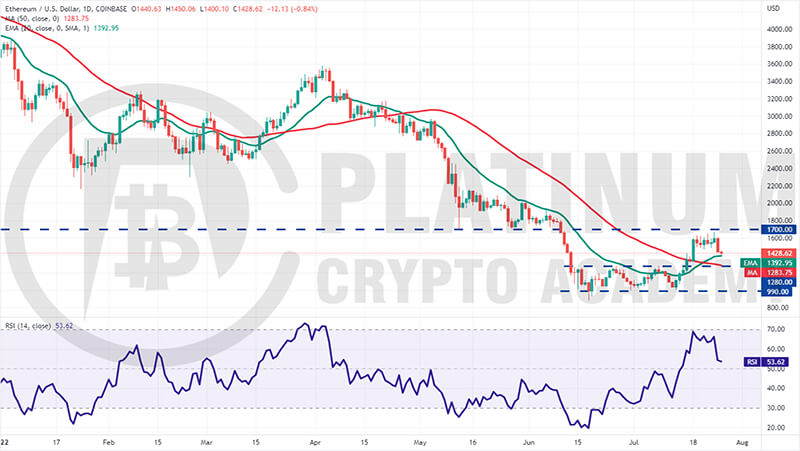
We said in our previous analysis that the bears are expected to mount a strong resistance at $1,700 and that is what happened. The bulls made several attempts but could not clear this hurdle in the past week.
The failure to do so may have attracted profit-booking from short-term traders on July 25. Ether has dipped to the 20-day EMA, which is an important level to keep an eye on.
A strong rebound off this support will suggest that bulls are buying on dips. That could increase the possibility of a break above $1,700. If that happens, the ETH/USD pair could rally to $2,000.
Alternatively, if the price breaks below the 20-day EMA, the pair could drop to the critical support at $1,280. A bounce off this level could keep the pair range-bound between $1,280 and $1,700 for a few days.
The bears will have to sink the price below $1,280 to indicate that they remain in control.
BNB/USD Market Analysis
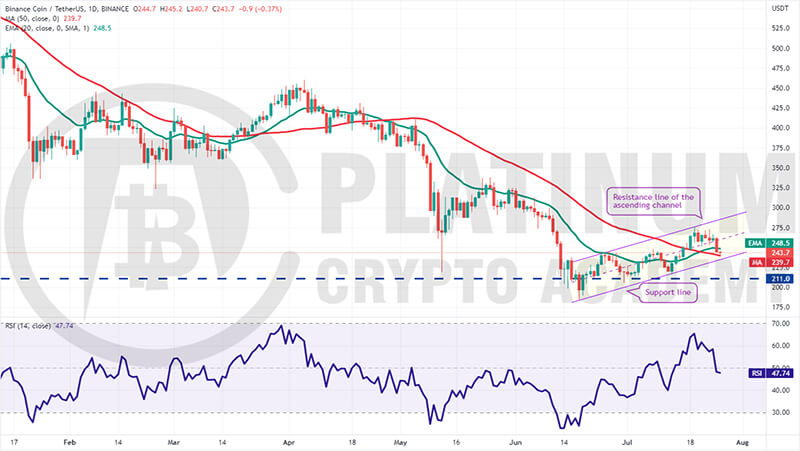
Binance Coin has been trading in an ascending channel for the past few days. The bulls tried to push the price above the resistance line of the channel on July 19 but the bears had other plans. They defended the level and started a move back toward the support line of the channel.
The bulls are likely to defend the support line with vigor. If the price rebounds off the support line, the BNB/USD pair may extend its stay inside the channel for a few more days.
The flattish 20-day EMA and the RSI just below the midpoint indicate a balance between supply and demand.
This advantage could tilt in favor of the sellers if the price breaks below the channel. If that happens, the pair could slide to the strong support at $211.
The bulls will have to push the price above the channel to signal the start of a rally toward $340.
XRP/USD Market Analysis
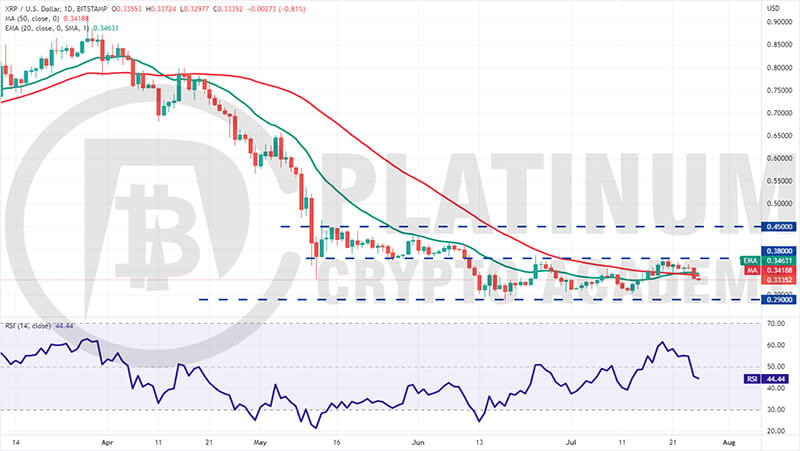
After trading between $0.38 and the 20-day EMA for the past few days, bears pulled XRP below the 50-day SMA on July 25. This suggests that the XRP/USD pair may remain stuck inside the $0.38 to $0.29 range for a few more days.
The flattish moving averages and the RSI just below the midpoint also indicate a range-bound action in the near term.
The bears will now attempt to sink the price to the crucial support at $0.29. This is an important level for the bulls to defend because a close below it could indicate the resumption of the downtrend.
Conversely, if the price rises from the current level, the pair could rise to the overhead resistance at $0.38. The bulls will have to overcome this barrier to indicate the start of a new up-move which could reach $0.45.
ADA/USD Market Analysis
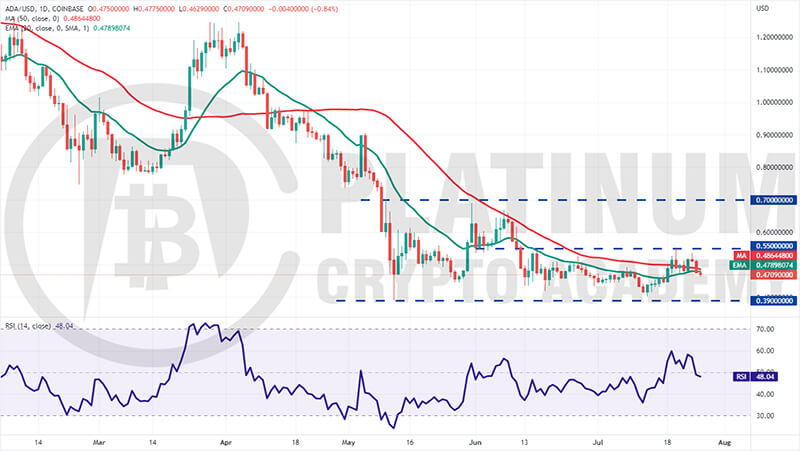
Cardano broke above the 50-day SMA on July 19 but the bulls could not build upon this strength. The long wick on the July 20 candlestick shows that bears aggressively sold near $0.55.
The bulls brought the dip to the 20-day EMA and again tried to clear the overhead hurdle on July 24 but the bears held their ground. This may have attracted profit-booking by the short-term traders which pulled the price back below the moving averages on July 25.
The ADA/USD pair could next drop to the strong support at $0.39. The bears will have to sink and sustain the price below the level to indicate the start of the next leg of the downtrend.
Alternatively, if the price turns up from the current level, the buyers will make one more attempt to push the pair above $0.55. If they succeed, the pair could rally to $0.60 and then to $0.70.
Hopefully, you have enjoyed today’s article for further coverage please check out our crypto Blog Page. Thanks for reading! Have a fantastic day! Live from the Platinum Crypto Trading Floor.
Earnings Disclaimer: The information you’ll find in this article is for educational purpose only. We make no promise or guarantee of income or earnings. You have to do some work, use your best judgement and perform due diligence before using the information in this article. Your success is still up to you. Nothing in this article is intended to be professional, legal, financial and/or accounting advice. Always seek competent advice from professionals in these matters. If you break the city or other local laws, we will not be held liable for any damages you incur.
