
The crypto markets witnessed panic selling last week after Terra’s LUNA token and the algorithmic stablecoin UST collapsed. The selling exacerbated further after the largest stablecoin tether (USDT) lost its dollar peg briefly. That pulled Bitcoin price to its lowest level since December 2020.
Bitcoin’s market capitalisation dropped to about $500 billion on May 12, a sharp fall from its all-time high market cap of about $1.3 trillion in early November of last year. The selling was even more fierce in altcoins which boosted Bitcoin’s dominance to about 45, its highest level in 2022, according to coinmarketcap data.
Crypto’s sharp fall in tandem with the stocks puts into question the narrative of digital assets being an uncorrelated asset. The three-month correlation between Bitcoin, Ether and the major US stock indexes reached between 0.67 and 0.78 last week, according to Dow Jones Market Data.
Miller Value Partners, Chairman Bill Miller in an interview with CNBC said that he had held on to a large portion of his Bitcoin holdings but had to sell some to satisfy margin calls. However, he remains bullish on Bitcoin. He said: “I’ve been through at least three declines of over 80%. I own it as an insurance policy against financial catastrophe. … I haven’t heard a good argument yet why anybody shouldn’t put at least 1% of their liquid net worth in bitcoin,” CoinDesk reported.
The big question worrying investors is whether to buy now or to wait for a further decline before purchasing. Arthur Hayes, former CEO of Bitmex, said in a blog post that “crypto capital markets must be allowed time to heal” He expects to become a buyer in Bitcoin near $20,000 and Ether at $1,300.
Could crypto markets rebound in the near term and offer a short-term buying opportunity to traders? As Bitcoin price has bottomed out, is it a good time to start investing in crypto currencies and building a crypto portfolio? Read our analysis of the major cryptocurrencies to find out.
BTC/USD Market Analysis
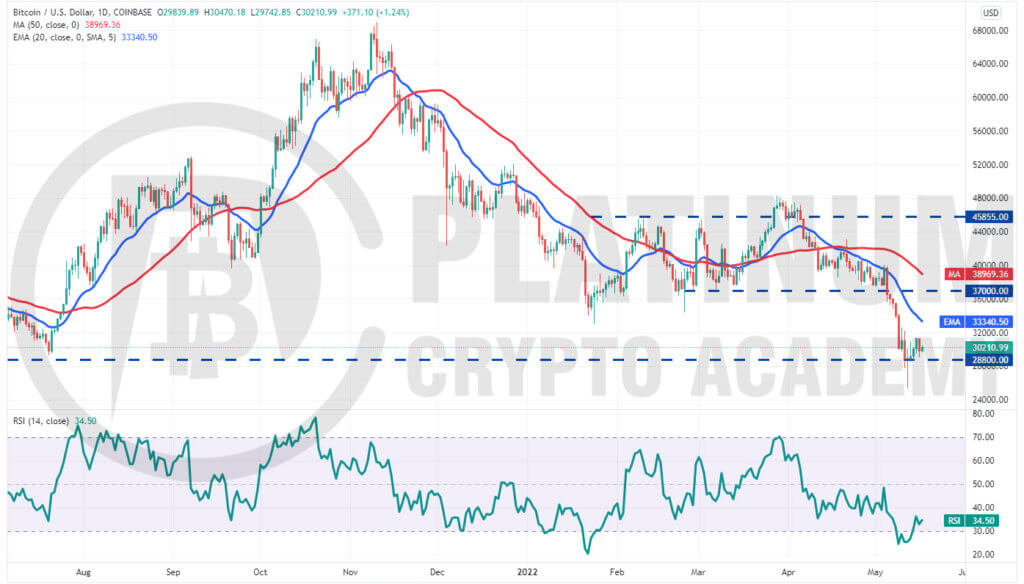
We had mentioned in our previous analysis that bulls will attempt to aggressively defend the zone between $30,000 and $28,800 and that is what happened. Although Bitcoin dipped to $25,338.53 on May 12, the long tail on the day’s candlestick shows strong buying Bitcoin at lower levels.
That started a rebound in the BTC/USD pair which is facing resistance near $31,500. The bears tried to sink the price back below $28,800 on May 16 but the bulls held their ground. The buyers will now make another attempt to push the price to the 20-day exponential moving average (EMA).
If the price turns down from this level, it will suggest that the sentiment remains negative and traders are selling on rallies. That could increase the possibility of a break below $28,800.
If that happens, the pair may drop to $25,338.53. A break and close below this support could open the doors for a possible drop to $20,000.
This negative view could invalidate in the short term if bulls propel the price above the 20-day EMA. Such a move will suggest that demand exceeds supply and the pair could then rise to the overhead resistance at $37,000.
ETH/USD Market Analysis
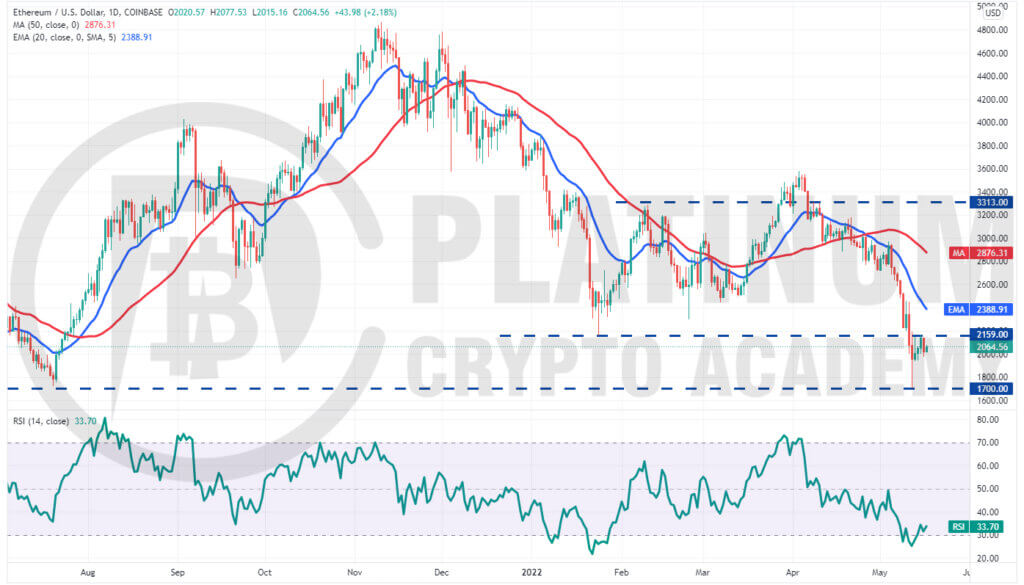
We had warned in our previous analysis that if the $2,159 support cracks, Ether could drop to $1,700 and that is what happened on May 12.
A minor positive is that the bulls aggressively purchased the dip to $1,700 as seen from the long tail on the May 12 candlestick.
The rebound reached the overhead resistance at $2,159 on May 13 but the bears held their ground. The sellers again thwarted attempts by the bulls to push the price above $2,159 on May 15 and May 16.
This suggests that bears are trying to flip the $2,159 level into resistance. However, a positive sign is that the buyers bought the dip to $2,000 on May 16. The bulls will again attempt to drive the price above $2,159.
If they succeed, the ETH/USD pair could rally to the 20-day EMA. The bears are expected to mount a strong defence at this level. If the price turns down from the 20-day EMA, the bears will try to sink the pair below $2,159 and then $2,000.
If either level holds, the pair may stay range-bound for a few days. A break and close above the 20-day EMA will be the first indication that the downtrend may be over. On the other hand, a break below $1,700 will suggest the resumption of the downtrend.
BNB/USD Market Analysis
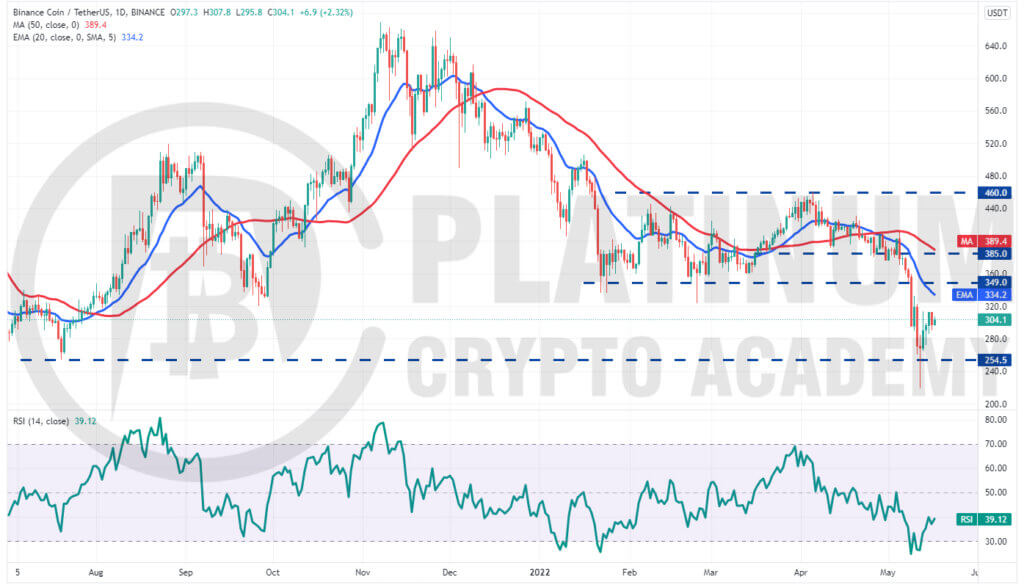
We had suggested in our previous analysis that if bulls fail to push Binance Coin above $349, the bears may sink the price to $254.50 and that is how it played out.
The BNB/USD pair plummeted below $254.50 on May 12 but the bulls aggressively purchased at lower levels resulting in a strong recovery. That started a relief rally and the bulls are now attempting to push the price to the 20-day EMA.
If the price turns down from the 20-day EMA, the pair may again drop toward $254.50 and consolidate between the two levels for a few days.
On the contrary, if buyers push the price above the 20-day EMA, it will suggest that the bottom may be in. The pair could then rally to $349 and later to the 50-day simple moving average (SMA).
The bears will have to sink and sustain the price below $254.50 to signal the start of the next leg of the downtrend.
XRP/USD Market Analysis
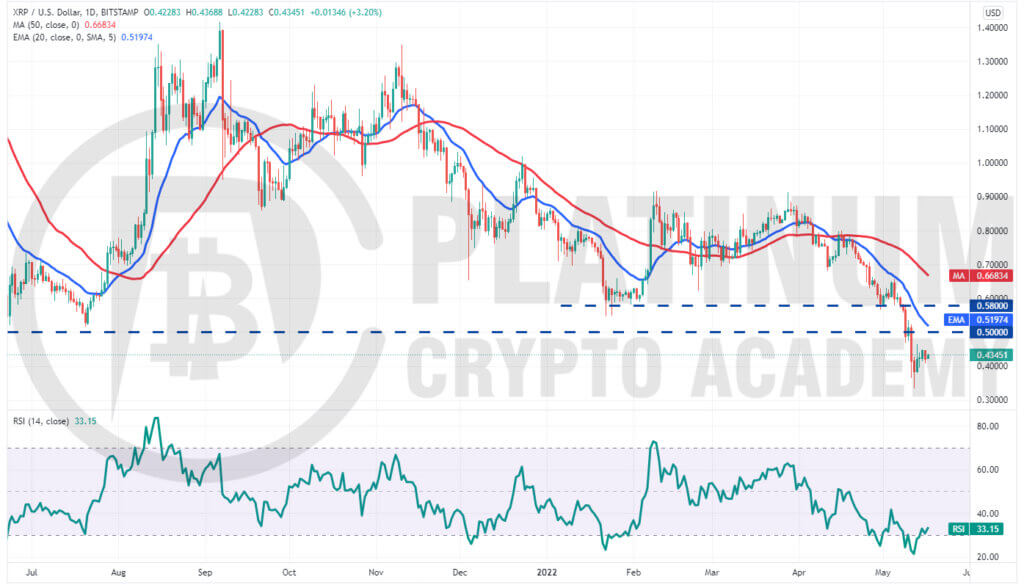
We had projected a decline to $0.40 in our previous analysis if the $0.50 support cracked. But XRP plunged further to $0.33 on May 12. That pulled the relative strength index (RSI) close to 21, indicating that the selling was overdone in the near term.
That started a rebound on May 13 but the long wick on the day’s candlestick shows that bears continue to sell at higher levels. The bears are likely to pose a strong challenge at the psychological level at $0.50.
If the price turns down from this resistance, the XRP/USD pair could oscillate between $0.50 and $0.33 for a few days.
Contrary to this assumption, if bulls push the price above $0.50, it will suggest that demand sustains at higher levels. That could open the doors for a possible ally to $0.65.
On the downside, the bears will have to sink the pair below $0.33 to indicate the resumption of the downtrend.
SOL/USD Market Analysis
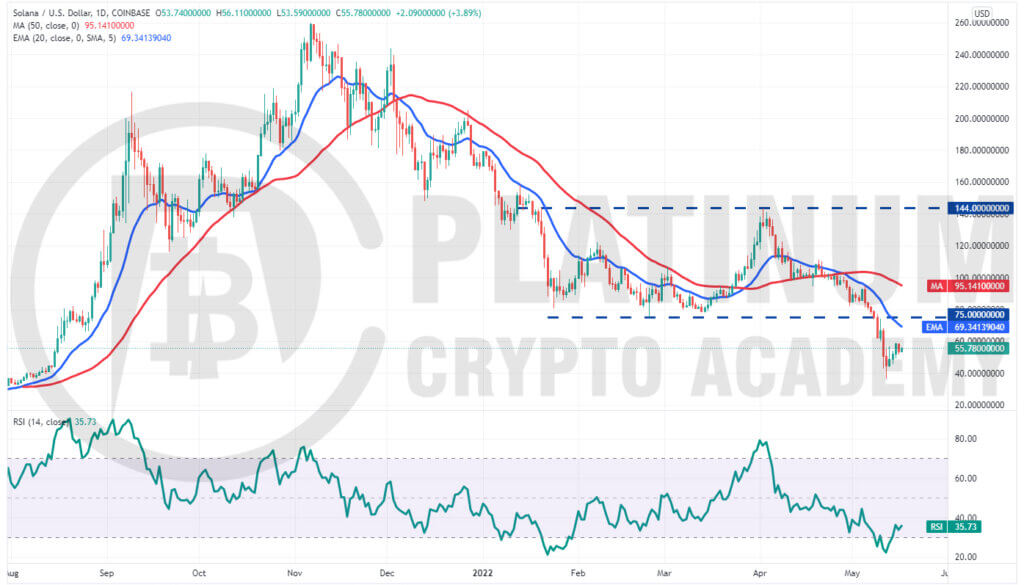
Solana’s recovery attempt on May 10 fizzled out at $75 and this renewed selling. We had projected the SOL/USD pair to decline to $40 but the pair plummeted to $36 on May 12. The bulls purchased this dip resulting in a relief rally.
The pair is facing strong resistance near $60 but a minor positive is that the bulls have not given up much ground. This increases the possibility of a rally to the 20-day EMA.
This is an important level to keep an eye on because if the price turns down from it, the bears will again try to pull the pair below $36 and resume the downtrend.
On the other hand, if bulls thrust the price above the 20-day EMA and the breakdown level of $75, it will suggest aggressive buying at lower levels. That could create an opening for a possible rally to the 50-day SMA.
Hopefully, you have enjoyed today’s article for further coverage please check out our crypto Blog Page. Thanks for reading! Have a fantastic day! Live from the Platinum Crypto Trading Floor.
Earnings Disclaimer: The information you’ll find in this article is for educational purpose only. We make no promise or guarantee of income or earnings. You have to do some work, use your best judgement and perform due diligence before using the information in this article. Your success is still up to you. Nothing in this article is intended to be professional, legal, financial and/or accounting advice. Always seek competent advice from professionals in these matters. If you break the city or other local laws, we will not be held liable for any damages you incur.
